ViewTube

ViewTube
Sign inSign upSubscriptions
Filters

Upload date

Type

Duration

Sort by

Features

Reset

633 results

Learn With Hiro
Python Project : Bar Graph using Matplotlib in Python || Code Practice for beginners

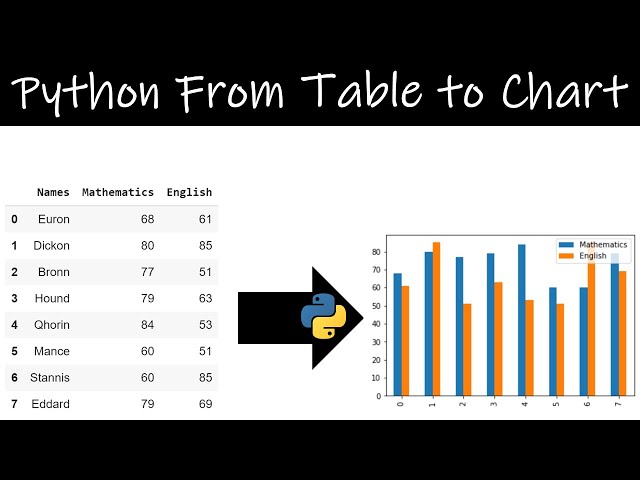
Welcome to this Python project tutorial where we dive into the fascinating world of data visualization! In this video, we will guide ...

1:35
Python Project : Bar Graph using Matplotlib in Python || Code Practice for beginners

5 views

2 years ago

Sujeet Kumar Advanced Excel Training in Hindi
Plot Graphs in Python in 1 Line! #matplotlib #python #visualization #shorts

Download Excel VBA MIS Learning - App - https://play.google.com/store/apps/details?id=co.hodor.jqijz iOS ...

1:05
Plot Graphs in Python in 1 Line! #matplotlib #python #visualization #shorts

5 views

1 month ago

Sujeet Kumar Advanced Excel Training in Hindi
Plot a Bar Chart in 10 Seconds! #pythonplots #matplotlib #visualization

Download Excel VBA MIS Learning - App - https://play.google.com/store/apps/details?id=co.hodor.jqijz iOS ...

0:43
Plot a Bar Chart in 10 Seconds! #pythonplots #matplotlib #visualization

155 views

1 month ago

Codanics
Datascience Roadmap with python in urdu/hindi #shorts

datascience #pythonkachilla #python #datascience #pythonkachilla #python #dataanalytics #pythonforbeginners ...

1:01
Datascience Roadmap with python in urdu/hindi #shorts

617 views

3 years ago

Vanderbilt Digital Lab
010g What is pyplot?

Introduction to plotting - What is pyplot?

1:46
010g What is pyplot?

191 views

5 years ago

DEEPTI SHARMA: Let's Learn Programming
#matplotlib #shorts #datavisualization #python #pandas #pandastutorial #pythontutorial #python3

What is Matplotlib Library?

0:13
#matplotlib #shorts #datavisualization #python #pandas #pandastutorial #pythontutorial #python3

52 views

3 years ago

Chas Nelson
Notebook 06 Exercise 6.10

Exercise 6.10 from Notebook 06 'for Loops in Python'. Part of the Python beginner's course hosted at ...

1:15
Notebook 06 Exercise 6.10

184 views

6 years ago

Codanics
Youtube playlist to master data analytics in 1 2 months on codanics youtube channel

Data Analytics playlist se 1-2 mah mein pro ban jao! Codanics ke YouTube channel par ye crash-to-master roadmap tumhein ...

0:47
Youtube playlist to master data analytics in 1 2 months on codanics youtube channel

5,539 views

8 months ago

Roel Van de Paar
A matplotlib scatter function inside a for loop

A matplotlib scatter function inside a for loop Helpful? Please support me on Patreon: https://www.patreon.com/roelvandepaar ...

2:29
A matplotlib scatter function inside a for loop

65 views

3 years ago

Codanics
Python for Kids in Urdu/Hindi – FREE Complete Playlist on Codanics youtube channel

Python for Kids in Urdu/Hindi – FREE Complete Playlist on Codanics youtube channel Want your kids to start coding?

1:06
Python for Kids in Urdu/Hindi – FREE Complete Playlist on Codanics youtube channel

3,664 views

9 months ago

Mirza Hasnat
How to Plot data from CSV file using pandas and matplotlib

shorts In this short video I'll show you how to plot data from csv file using pandas,matplotlibPlease Like Shareand Subscribe ...

0:52
How to Plot data from CSV file using pandas and matplotlib

182 views

4 years ago

DEEPTI SHARMA: Let's Learn Programming
#pyplot #python #shorts #pandas #pythontutorial #pandastutorial #datavisualization #python3

What is Pyplot ?

0:14
#pyplot #python #shorts #pandas #pythontutorial #pandastutorial #datavisualization #python3

170 views

3 years ago

PyCharmers
Python PANDAS for Beginners | Data Analysis Made Easy  #coding #pythonlearning #pythonprogramming

Welcome to our comprehensive tutorial on **Python PANDAS for Beginners**! In this video, we will dive into the powerful world of ...

0:37
Python PANDAS for Beginners | Data Analysis Made Easy #coding #pythonlearning #pythonprogramming

93,816 views

1 year ago

Chas Nelson
Notebook 07 Exercise 7.5

Exercise 7.5 from Notebook 07 'if Statements in Python'. Part of the Python beginner's course hosted at ...

1:28
Notebook 07 Exercise 7.5

97 views

6 years ago

Isidro González
Evolution of the fit to a gaussian distributed measurement

This video shows how the fit to a probabilistic distribution improves as more values are used. This example uses random numbers ...

0:13
Evolution of the fit to a gaussian distributed measurement

106 views

6 years ago

Sasyuk
#Noisevember 09 MEGADRONE #python #simpleaudio #matplotlib

Today I decided that I needed my own scalable N-oscilator megadrone. Like other people ...

0:59
#Noisevember 09 MEGADRONE #python #simpleaudio #matplotlib

206 views

5 years ago

Anaconda, Inc.
3 Python viz tips for Excel

You can now visualize your data using Python in Excel! + = Watch here as Anaconda's Sophia Yang walks through three ...

0:37
3 Python viz tips for Excel

23,896 views

2 years ago

COMPUTER & EXCEL SOLUTION
Create a function to find prime number in python in hindi@COMPUTEREXCELSOLUTION

Join this channel to get access to perks: https://www.youtube.com/channel/UC4C_tfy6WLDxzVVO3y6YinA/join This is my ...

0:51
Create a function to find prime number in python in hindi@COMPUTEREXCELSOLUTION

67 views

2 years ago

Peter Schneider
TypeError: barplot() takes from 0 to 1 positional arguments but 2 were given

TypeError: barplot() takes from 0 to 1 positional arguments but 2 were given [duplicate] I hope you found a solution that worked for ...

2:47
TypeError: barplot() takes from 0 to 1 positional arguments but 2 were given

3,106 views

2 years ago

Pro Bono
Plot Table Data to Chart Using Pandas | Pandas Library | Python

Plot Table Data to Chart Pandas Library Dataframe multiple colum graph plot Python.

3:32
Plot Table Data to Chart Using Pandas | Pandas Library | Python

206 views

5 years ago