ViewTube

ViewTube
Sign inSign upSubscriptions
Filters

Upload date

Type

Duration

Sort by

Features

Reset

30,837 results

DsCs
The Ultimate Data Visualization Tools Overview #matplotlib  #seaborn  #plotly

In this video, we dive deep into the world of data visualization in Python using three powerful libraries: Matplotlib, Seaborn, and ...

0:51
The Ultimate Data Visualization Tools Overview #matplotlib #seaborn #plotly

2,651 views

1 year ago

Real Python
Matplotlib vs Seaborn vs Plotly: Best Python Visualization Tools

Matplotlib vs Seaborn vs Plotly: Best Python Visualization Tools.

1:18
Matplotlib vs Seaborn vs Plotly: Best Python Visualization Tools

2,616 views

3 months ago

ThrillQuestPlay
🐍 Python Plotly Tutorial: Create Animated Visualizations FAST 📊

YouTube Video Description Welcome to another exciting data visualization tutorial on DataViz! In this video, we dive into ...

3:01
🐍 Python Plotly Tutorial: Create Animated Visualizations FAST 📊

592 views

9 months ago

Coding Is Fun
6 Quick Fixes to Improve Your Plotly Express Charts

Explore All My Excel Solutions: https://pythonandvba.com/solutions DESCRIPTION ...

3:47
6 Quick Fixes to Improve Your Plotly Express Charts

8,942 views

2 years ago

Andrew Seier
Python to Plotly to Python

Use plotly's Python API to easily visualize your data. Then, edit that plot on the web with our user-friendly GUI. When you save this ...

0:32
Python to Plotly to Python

1,803 views

11 years ago

Stats Wire
Install Plotly in Python | Plotly | Python | Jupyter Notebook

Install Plotly in Python | Plotly | Python | Jupyter Notebook GitHub JupyterNotebook: https://github.com/siddiquiamir/ GitHub Data: ...

3:10
Install Plotly in Python | Plotly | Python | Jupyter Notebook

34,079 views

3 years ago

Coding Is Fun
Create Stunning Calendar Heatmaps in Python (with ONE Line of Code!)

Explore All My Excel Solutions: https://pythonandvba.com/solutions DESCRIPTION ...

3:58
Create Stunning Calendar Heatmaps in Python (with ONE Line of Code!)

3,076 views

1 year ago

New learning Everyday
Learn Plotly in Python: Create Interactive Data Visualizations

In this video, you'll learn how to use the Plotly library in Python to create interactive data visualizations. We'll cover the basics of ...

2:20
Learn Plotly in Python: Create Interactive Data Visualizations

32 views

2 years ago

Pythology
Python Data Visualization: Plotly and Bokeh

Learn how to create interactive and complex visualizations using Plotly and Bokeh libraries in Python. Music credits: Lost In ...

1:13
Python Data Visualization: Plotly and Bokeh

851 views

2 years ago

LUNCHCOFFEE
how to create a 3D scatter plot using Python Plotly

In this video tutorial, we will explore how to create a 3D scatter plot using Python Plotly. A scatter plot is a popular data ...

1:40
how to create a 3D scatter plot using Python Plotly

535 views

2 years ago

AI Evolutionary
Create an Interactive Annotated Timeline Using Python | Data Visualization with Matplotlib & Plotly

Learn how to create an interactive Annotated Timeline using Python! In this tutorial, we will explore Matplotlib, Plotly, and Pandas ...

1:29
Create an Interactive Annotated Timeline Using Python | Data Visualization with Matplotlib & Plotly

172 views

10 months ago

Code With Alex
Visualize Data with Plotly in Python #python #coding #programming
1:51
Visualize Data with Plotly in Python #python #coding #programming

938 views

1 year ago

CodeVisium
Plotly Explained The Interactive Data Visualization Library for Data Science#Plotly #PythonLibraries

Plotly is one of the most advanced and interactive data visualization libraries in Python, used for building everything from simple ...

0:06
Plotly Explained The Interactive Data Visualization Library for Data Science#Plotly #PythonLibraries

786 views

3 months ago

Mubeen Ali
Multipage app with side panel in python by plotly dash

Multipage app with side panel in python by plotly dash. View live this application. https://kpi-sales-dashboard.herokuapp.com/ ...

0:56
Multipage app with side panel in python by plotly dash

5,304 views

2 years ago

Analytics Vidhya
Why Data Scientists prefer Plotly? 💡

Plotly produces interactive graphs, that can be embedded on websites, and provides a wide variety of complex plotting options.

0:44
Why Data Scientists prefer Plotly? 💡

8,317 views

1 year ago

Charming Data
Learn Python, Plotly, Dash, and AI with others in 2025

Join our community project to practice and build your Python, Plotly, and AI skills alongside supportive community members.

1:45
Learn Python, Plotly, Dash, and AI with others in 2025

897 views

1 year ago

KGP Talkie
3D Plot in Plotly | Data Visualization in Python

Hi Everyone, I'm excited to announce my brand-new *Udemy* course available at ONLY 399INR/$9.99USD: Learn to build ...

3:35
3D Plot in Plotly | Data Visualization in Python

6,092 views

5 years ago

Guillermo Izquierdo
Gráficos Interactivos con Plotly Python - Definiciones - Curso Básico

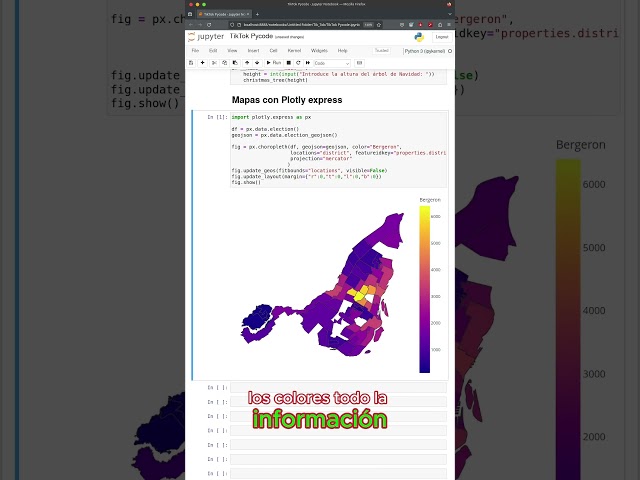
Código y más detalles en: https://www.pypro.mx --------------------------------- Regístrate y obtén 10 Dólares GRATIS en ByBit ...

2:10
Gráficos Interactivos con Plotly Python - Definiciones - Curso Básico

3,607 views

2 years ago

VaniaDev
Graficos de Mapas con Plotly Express #python #programacion #plotly #backend #codigo

Hola comunidad brillante! Gracias infinitas por sintonizar nuestro video. ¡La diversión no termina aquí! Descubre más de ...

0:44
Graficos de Mapas con Plotly Express #python #programacion #plotly #backend #codigo

413 views

11 months ago