ViewTube

ViewTube
Sign inSign upSubscriptions
Filters

Upload date

Type

Duration

Sort by

Features

Reset

255 results

The Debug Zone
How to Attach VS Code Debugger to Internet Explorer 11 for JavaScript

In this video, we'll guide you through the process of attaching the Visual Studio Code debugger to Internet Explorer 11 for ...

1:30
How to Attach VS Code Debugger to Internet Explorer 11 for JavaScript

4 views

3 months ago

CraftingCode
¡Estás Depurando Mal!, usa VS Code

Estás Depurando Mal!, usa VS Code.

2:06
¡Estás Depurando Mal!, usa VS Code

25 views

2 years ago

Aurélien Pupier
Camel Textual Debugger with Camel yaml DSL in VS Code

Camel Textual Debugger with Camel yaml DSL in VS Code using VS Code Debug Adapter for Apache Camel and the main-yaml ...

2:06
Camel Textual Debugger with Camel yaml DSL in VS Code

1,091 views

3 years ago

Aurélien Pupier
Camel Textual Debugger with Camel XML DSL in VS Code

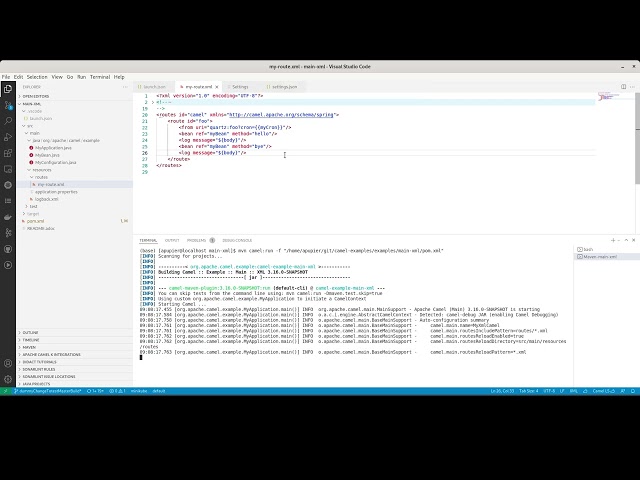
Demo how to connect the Camel Textual Debugger with Camel XML DSL in VS Code with VS Code Debug Adapter for Apache ...

1:41
Camel Textual Debugger with Camel XML DSL in VS Code

668 views

3 years ago

Roel Van de Paar
Visual Studio Code debugger for Node application stops at runMicroTasks in next_tick.js instead...

Visual Studio Code debugger for Node application stops at runMicroTasks in next_tick.js instead of in the specified breakpoint ...

1:40
Visual Studio Code debugger for Node application stops at runMicroTasks in next_tick.js instead...

6 views

5 years ago

Aurélien Pupier
How to connect Camel textual debugger in VS Code with version 0.1

Connection of the Camel Textual Debugger has been greatly simplified in VS Code Debugger Adapter for Camel extension ...

1:19
How to connect Camel textual debugger in VS Code with version 0.1

86 views

3 years ago

Roel Van de Paar
VSCode debug Typescript app

VSCode debug Typescript app Helpful? Please use the *Thanks* button above! Or, thank me via Patreon: ...

2:06
VSCode debug Typescript app

16 views

3 years ago

Aurélien Pupier
Start with JBang and Camel debug with a built-in single-command  in VS Code

requirements: - VS Code Debug Adapter for Camel 0.2.0+ - jbang installed on command-line.

1:00
Start with JBang and Camel debug with a built-in single-command in VS Code

603 views

3 years ago

ọzkriff
vscode rust debug test
1:30
vscode rust debug test

1,568 views

7 years ago

Aurélien Pupier
Textual debug for Apache Camel with VS Code

This is the video for a first iteration of Camel textual Debug with VS Code. Please read scope and requirements on ...

2:21
Textual debug for Apache Camel with VS Code

442 views

3 years ago

Aurélien Pupier
How to Camel debug a Camel Quarkus 2.12+ route in VS Code

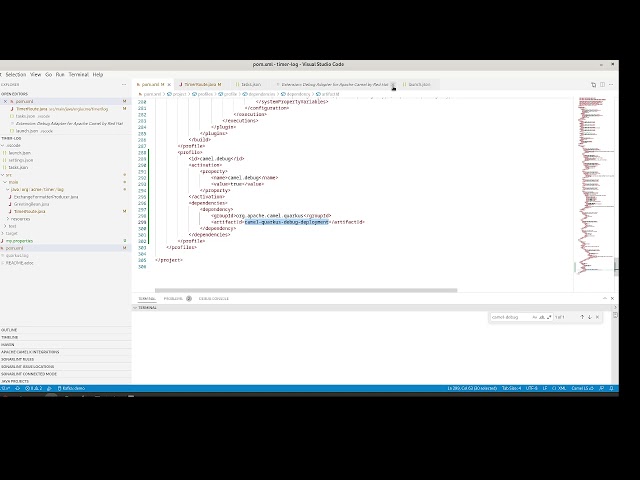
How to Camel debug Camel Quarkus 2.12+ route in VS Code - Configure pom to add the correct dependency - Create Task using ...

2:38
How to Camel debug a Camel Quarkus 2.12+ route in VS Code

468 views

3 years ago

Roel Van de Paar
How can I start Live server and Chrome debugger for VS Code in one click?

How can I start Live server and Chrome debugger for VS Code in one click? Helpful? Please support me on Patreon: ...

1:56
How can I start Live server and Chrome debugger for VS Code in one click?

10 views

4 years ago

Chrome for Developers
Breakpoints and logpoints #DevToolsTips

Discover 5 different ways to debug your code beyond console.log - Discover the breakpoints, debugger statements, logpoints, ...

3:41
Breakpoints and logpoints #DevToolsTips

43,248 views

2 years ago

TLA+ - The Temporal Logic of Actions
Debug TLA+ proof manager TLAPM inside VSCode

Prerequisite command-line setup recorded at https://asciinema.org/a/307459.

2:01
Debug TLA+ proof manager TLAPM inside VSCode

258 views

5 years ago

Roel Van de Paar
Sharepoint: SPFx breakpoints and debugging from Visual Studio Code instead from Chrome

Sharepoint: SPFx breakpoints and debugging from Visual Studio Code instead from Chrome Helpful? Please support me on ...

1:18
Sharepoint: SPFx breakpoints and debugging from Visual Studio Code instead from Chrome

48 views

4 years ago

AUTOHOTKEY Gurus
💻 Master script debugging like a pro - Display text with any editor!

If you work with multiple editors, or collaborate with people that use different ones, it can be a pain to change how the debugging ...

3:18
💻 Master script debugging like a pro - Display text with any editor!

526 views

3 years ago

Roel Van de Paar
Software Engineering: How to debug minified javascript on production?

Software Engineering: How to debug minified javascript on production? Helpful? Please support me on Patreon: ...

1:37
Software Engineering: How to debug minified javascript on production?

41 views

3 years ago

Jian Wei Tay
Debugging for loops and if statements

Learn how to debug for loops and if statements in MATLAB.

3:59
Debugging for loops and if statements

1,354 views

5 years ago

Aurélien Pupier
How to use Camel Textual Route Debugger when executing Camel test in VS Code - Camel 3.18+

code of example used in demo: https://github.com/apupier/camel-examples/tree/demo-blogpost-test-v2/examples/main This is an ...

3:19
How to use Camel Textual Route Debugger when executing Camel test in VS Code - Camel 3.18+

136 views

3 years ago