ViewTube

ViewTube
Sign inSign upSubscriptions
Filters

Upload date

Type

Duration

Sort by

Features

Reset

129,992 results

Kite
HOW TO USE Matplotlib in 4 MINUTES (2020 Python Tutorial)

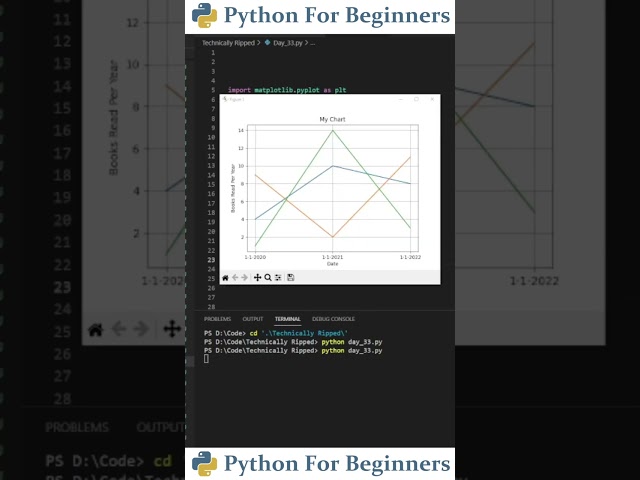
In this video we'll go over the Matplotlib library for Python. Matplotlib is a popular library for creating graphs, plots, and other data ...

3:54
HOW TO USE Matplotlib in 4 MINUTES (2020 Python Tutorial)

162,643 views

5 years ago

DsCs
The Ultimate Data Visualization Tools Overview #matplotlib  #seaborn  #plotly

In this video, we dive deep into the world of data visualization in Python using three powerful libraries: Matplotlib, Seaborn, and ...

0:51
The Ultimate Data Visualization Tools Overview #matplotlib #seaborn #plotly

1,494 views

1 year ago

Mo Chen
How to learn Python fast for data analysis? #dataanalyst #python #pandas #numpy #matplotlib

When You Learn Python please make sure that you don't go away and do endless General programming tutorials I've done that ...

0:43
How to learn Python fast for data analysis? #dataanalyst #python #pandas #numpy #matplotlib

112,602 views

1 year ago

Osman Gul
Simple Real-Time Force Sensor Serial Data Plotting in Python (Matplotlib)

https://osmangul.com/2023/03/28/simple-real-time-force-sensor-serial-data-plotting-in-python-matplotlib/

0:08
Simple Real-Time Force Sensor Serial Data Plotting in Python (Matplotlib)

34,373 views

2 years ago

Mo Chen
Tableau vs Matplotlib in Python (Which one is better?) #dataanalysis#datavisualization
0:59
Tableau vs Matplotlib in Python (Which one is better?) #dataanalysis#datavisualization

3,061 views

1 year ago

Real Python
Matplotlib vs Seaborn vs Plotly: Best Python Visualization Tools

Matplotlib vs Seaborn vs Plotly: Best Python Visualization Tools.

1:18
Matplotlib vs Seaborn vs Plotly: Best Python Visualization Tools

2,360 views

2 months ago

TechnicallyRipped
How To Plot Multiple Line Using Matplotlib | Python For Beginners

In this video I show you how to plot multiple lines using the matplotlib library in Python, and how to change the line's color #coding ...

0:53
How To Plot Multiple Line Using Matplotlib | Python For Beginners

3,043 views

2 years ago

Amit Thinks
1. Matplotlib Introduction & Features| Python Matplotlib Tutorial for Beginners | Amit Thinks

In this lesson, learn what is Matplotlib with its features. Matplotlib is an open-source plotting library developed by John D. Hunter.

2:25
1. Matplotlib Introduction & Features| Python Matplotlib Tutorial for Beginners | Amit Thinks

23,965 views

1 year ago

CodeVisium
Matplotlib Explained | The Foundation of Python Data Visualization #Matplotlib #DataScience

Matplotlib is the most fundamental and widely used data visualization library in Python, forming the backbone of libraries like ...

0:06
Matplotlib Explained | The Foundation of Python Data Visualization #Matplotlib #DataScience

677 views

2 months ago

The Why Guy
Day 3/100: Mastering Data Visualization with Matplotlib in Python #Matplotlib #100daysofcode

Join me on Day 3/100 of my Python journey as I dive into Matplotlib, the powerful library for creating stunning data visualizations!

0:19
Day 3/100: Mastering Data Visualization with Matplotlib in Python #Matplotlib #100daysofcode

43,861 views

1 year ago

GoodyPython Lab
Data Visualization with matplotlib and seaborn in python. #coding #explore #programming #python
0:09
Data Visualization with matplotlib and seaborn in python. #coding #explore #programming #python

6,217 views

1 year ago

Mr. Scientist
Plot Graph in Python using Matplotlib🔥 | #shorts #matplotlib #python

Hello guys, Welcome to my channel Mr. Scientist..... #shorts #python #pythonprogramming #coding #mrscientist #coding ...

0:51
Plot Graph in Python using Matplotlib🔥 | #shorts #matplotlib #python

26,868 views

3 years ago

AviW Codes
excellent 3D surface with #matplotlib #python

Code: https://github.com/aviwcodes/youtube-shorts/blob/master/plot_shorts/05%20Triangular%203D%20surfaces.py.

0:33
excellent 3D surface with #matplotlib #python

4,647 views

3 years ago

Progma Engineer
Matplotlib Markers Tutorial | Python Plotting Tips | Data Visualization

Learn how to use Matplotlib markers in Python for better data visualization. This quick Python plotting tutorial shows different ...

0:29
Matplotlib Markers Tutorial | Python Plotting Tips | Data Visualization

263 views

2 months ago

OualiCode
Python || 3D plotting using Matplotlib  #python#shorts  #oualicode #coding #3d

Tags : #oualicode #python#shorts #oualicode #coding #3d python turtle graphics tutorial python turtle tutorial python turtle ...

0:19
Python || 3D plotting using Matplotlib #python#shorts #oualicode #coding #3d

18,681 views

1 year ago

Gautam Dewasi Official
Top 5 Data Science Libraries #numpy #datascience #pandas #matplotlib #streamlit #python #ml #machine
0:19
Top 5 Data Science Libraries #numpy #datascience #pandas #matplotlib #streamlit #python #ml #machine

6,335 views

11 months ago

The Data Analyst
Data Visualization using Python Matplotlib Library | Data Science | #datascience #dataanalytics

datavisualization #datascience #python #matplotlib #pythonprogramming #machinelearning #ai #artificialintelligence ...

0:14
Data Visualization using Python Matplotlib Library | Data Science | #datascience #dataanalytics

17,625 views

2 years ago

Neural Bahn
How to create subplots using for loop in matplotlib #matplotlib #python #datascience

How to create subplots using for loop in matplotlib #matplotlib #python #datascience.

0:26
How to create subplots using for loop in matplotlib #matplotlib #python #datascience

795 views

2 years ago

TechnicallyRipped
How to Make Stackplots in Matplotlib | Python Tutorial

Learn how to create beautiful stackplots in Matplotlib. This tutorial shows step-by-step how to visualize cumulative data, compare ...

1:01
How to Make Stackplots in Matplotlib | Python Tutorial

1,161 views

2 months ago

Code Genic
Visualize 3D Data with Python | Matplotlib Tutorial #python

Learn how to create a 3D scatter plot in Python with just a few lines of code! Using Matplotlib and Axes3D, you can easily ...

0:25
Visualize 3D Data with Python | Matplotlib Tutorial #python

523 views

3 months ago