Upload date
All time
Last hour
Today
This week
This month
This year
Type
All
Video
Channel
Playlist
Movie
Duration
Short (< 4 minutes)
Medium (4-20 minutes)
Long (> 20 minutes)
Sort by
Relevance
Rating
View count
Features
HD
Subtitles/CC
Creative Commons
3D
Live
4K
360°
VR180
HDR
109,621 results
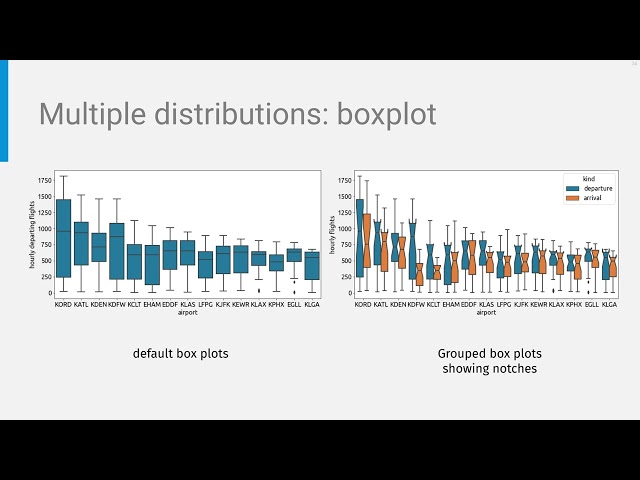
A video lecture from the online course "AI Skills for Engineers: Data Engineering and Data Pipelines" To learn more about this ...
483 views
2 years ago
This first video of my "Introduction to Seaborn" series covers the basics of seaborn, a Python library for data visualization. Here ...
79,162 views
5 years ago
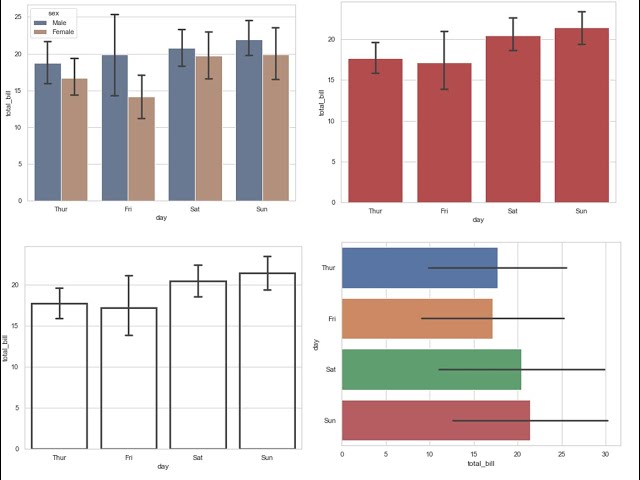
In this video Rob, a Kaggle Grandmaster, quickly and humorously walks through each of the popular plotting and data ...
107,712 views
3 years ago
If you work with data in Python, at some point you'll need to visualize it. In this video, I'll show you the differences ...
1,522 views
8 months ago
In my last video, I showed how elegant and simple plotnine makes the Grammar of Graphics in Python. This time, I put Seaborn's ...
323 views
3 months ago
The Seaborn FacetGrid is a great way to make multiple subplots within Python. It allows you to map any of the standard Seaborn ...
6,532 views
This French Python tutorial introduces you to Seaborn, the best library for data visualization. Seaborn allows you to create ...
121,698 views
6 years ago
Learn how you can quickly make statistical visuals in Seaborn, Python's best library for data visualization. Find the notebook here: ...
17,128 views
This seaborn violinplot video covers the basics of how to interpret and build a violin plot in Python seaborn. I begin by sharing a ...
25,273 views
The Seaborn pairplot allows us to easily take a dataframe and generate a single figure showing the relationships between all of ...
9,016 views
Data Used: https://www.nasdaq.com/market-activity/stocks/aapl/historical Google Colab Link: https://colab.research.google.com/ ...
8,744 views
This seaborn clustermap tutorial video shows you how to create a clustermap using Python seaborn. First we talk about what the ...
17,491 views
4 years ago
Seaborn is a popular visualization library for Python. It makes it easy to create great graphs and charts -- even when using only a ...
3,231 views
In this video, I will provide a high-level overview of the Top 5 Python libraries for Data Visualization that you can use to create ...
54,539 views
The Seaborn heatmap is a simple visual that allows you to display tables of data through color. This Seaborn heatmap tutorial ...
72,428 views
In this python seaborn tutorial I have shown you how you can create point plot which is one of the nicest way to visualize data and ...
489 views
This Seaborn relplot tutorial video shows you how to visualize variable relationships with the relplot. I first walk you through the ...
10,264 views
This video is a tutorial on relplot that uses both scatterplot and lineplot. Here is the GitHub link to the code of this tutorial: ...
498 views
The seaborn swarmplot is described in detail in this Python seaborn tutorial. First, I explain what a swarm plot is, how you can ...
10,413 views
In this video, you'll learn about creating regression plots using Seaborn. Seaborn is essential to Machine Learning! It allows you to ...
1,362 views