Upload date
All time
Last hour
Today
This week
This month
This year
Type
All
Video
Channel
Playlist
Movie
Duration
Short (< 4 minutes)
Medium (4-20 minutes)
Long (> 20 minutes)
Sort by
Relevance
Rating
View count
Features
HD
Subtitles/CC
Creative Commons
3D
Live
4K
360°
VR180
HDR
10,891 results
Example code: https://rebrand.ly/kg1qk17 Chapters 00:00 - Intro to Matplotlib 00:29 - Install Matplotlib 00:35 - Import pyplot ...
6,398 views
11 months ago
python #coding #matplotlib Matplotlib is a Python library used for data visualization. It provides a MATLAB-like interface for quick ...
20,126 views
2 months ago
Python Code: import matplotlib.pyplot as plt x = [1, 2, 3, 4, 5] y = [1, 4, 9, 16, 25] plt.plot(x, y, linewidth=3, marker='+', color='green') ...
7,575 views
1 month ago
Master Matplotlib for your next data science interview! This comprehensive tutorial covers everything you need to know about ...
116 views
3 months ago
In this video, learn how to install matplotlib on Windows. We will also install Python 3 and pip. PIP is used to install and manage ...
685 views
4 weeks ago
Learn how to build clean, minimalist charts using Python, Pandas, and Matplotlib—just like The Economist. Jupyter Notebook: ...
93 views
9 months ago
I show how to create radar charts or spidar charts with "multiple scales on multiple axes" in Python using matplotlib. Matplotlib ...
326 views
10 months ago
Learn how to create a complete Sales Data Analysis project in Python. In this step-by-step tutorial, we will cover: Importing and ...
150 views
2 weeks ago
python #coding #matplotlib This video serves as a project where we will create a bar chart based on the primary Type of the ...
7,146 views
If you work with data in Python, at some point you'll need to visualize it. In this video, I'll show you the differences ...
1,530 views
8 months ago
In this video, you'll learn how to create a Pie Chart using Matplotlib in Python—perfect for beginners and intermediate learners!
125 views
python #coding #matplotlib In this video I will show you how to create subplots using Matplotlib.
6,527 views
Want to learn how to create a stacked bar chart in Python? In this tutorial, we'll use Matplotlib to visualize data effectively with ...
156 views
Master AI from Zero to Advanced: https://ailearninghub.io ------------------------- In this video, you'll learn how to create and customize ...
166 views
In this video, you'll learn how to install the matplotlib library in Python. It shows how to use the pip command to install ...
302 views
python #coding #matplotlib In this video we will create a basic scatter plot using Matplotlib. Here is some sample data you can ...
5,972 views
In this video, we'll create a simple line graph in Python using Matplotlib to visualize global temperature changes from 1880 to ...
86 views
7 months ago
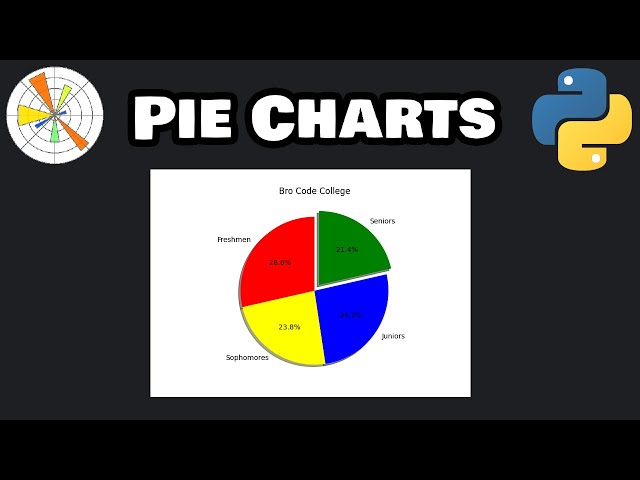
python #coding #matplotlib In this video we will create a basic pie chart using Matplotlib.
6,474 views
... Jupyter Notebook to run python matplotlib https://jupyter.org/try-jupyter/lab/ --------------------------------------------------- 00:00 : Recap ...
63,292 views
Do you want to learn how to turn real-world data into beautiful charts in just a few lines of Python? In this beginner-friendly video, ...
26 views


![How to Install Matplotlib with latest Python 3.14 on Windows 10/11 [2025 Update] Matplotlib Tutorial](/api/proxy/image?url=https%3A%2F%2Fi.ytimg.com%2Fvi%2FJqTjyPhRHMw%2Fsddefault.jpg)