Upload date
All time
Last hour
Today
This week
This month
This year
Type
All
Video
Channel
Playlist
Movie
Duration
Short (< 4 minutes)
Medium (4-20 minutes)
Long (> 20 minutes)
Sort by
Relevance
Rating
View count
Features
HD
Subtitles/CC
Creative Commons
3D
Live
4K
360°
VR180
HDR
333 results
In Part 2 of this Data Visualization with Python Course 2026, you will learn how to visualize data distributions, relationships, and ...
95 views
7 days ago
In Part 3 of this Data Visualization with Python Course 2026, you will create categorical, advanced statistical, and geospatial ...
46 views
2 days ago
0 views
In Ep 11 of our Python Data Analysis series, we learn how to visualize data using Matplotlib. After cleaning and exploring data ...
5 days ago
... industry flow is SQL it pulls the data BI it presents the data python it it helps in core analyzing this is the overview and if then with ...
20 views
4 days ago
Ready to start your Data Science journey with Python? This video is the perfect starting point for beginners, students, and aspiring ...
13 views
1 day ago
Want to turn raw CSV data into clean, professional charts using Python? In this video, you'll learn how to read a CSV file and plot ...
33 views
In this video, you will learn the Python Seaborn library for data visualization. Seaborn is a powerful Python library built on top of ...
5 views
Histogram Boxplot Scatterplot Bar chart Pairplots In Python.
The provided text outlines a career roadmap for individuals seeking to enter the fields of data analytics and data science using ...
24 views
https://mckayjohns.substack.com/
67 views
Maximum Likelihood Estimation (MLE) is powerful, but it has a fatal flaw: It is naive. If you flip a coin 5 times and get 5 Heads, MLE ...
23 views
3 days ago
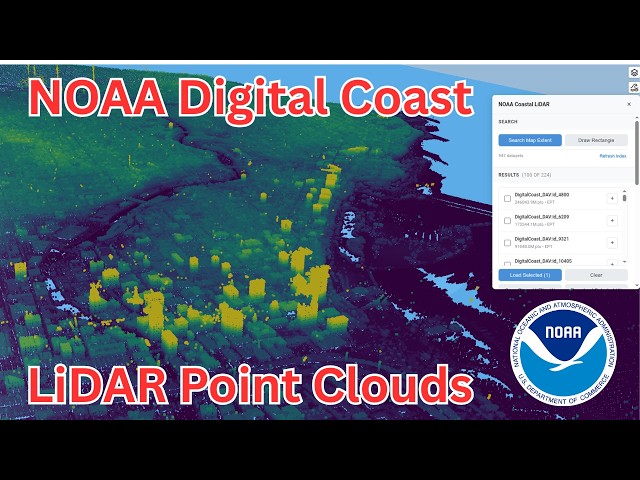
Want to easily explore and visualize LiDAR point clouds from NOAA Digital Coast? In this step-by-step tutorial, you'll learn how to ...
376 views
In this video, you will learn how to use Matplotlib in Machine Learning for powerful data visualization using Python. Matplotlib is ...
In this first lecture of the Data Analysis Using Python series, we learn how to start a data analysis project using Google Colab and ...
Python is evolving fast — and 2026 is packed with powerful new libraries transforming AI, automation, data science, and web ...
Love working with Jupyter notebooks? So do we! But what if you could take them further? In this video, you'll learn how to use ...
904 views
Free Data Analyst KickStarter Pack - https://datacoaching4628.graphy.com/courses/dataanalyst-freecourse Check Data Analytics ...
128 views
5 hours ago
Welcome to the Tutorials for Data Analytics and Visualization using Python playlist! In this video, we introduce the ...
3 views
6 days ago
Are you starting your journey in Data Analysis with Python? In this video, I explain the fundamentals of Exploratory Data Analysis ...
34 views
![Data Visualization with Python Course [2026] - Part 2: Distribution & Time Series Charts](/api/proxy/image?url=https%3A%2F%2Fi.ytimg.com%2Fvi%2Ftaa64u_CcYk%2Fsddefault.jpg)
![Data Visualization with Python Course [2026] - Part 3: Categorical, Statistical & Geospatial Charts](/api/proxy/image?url=https%3A%2F%2Fi.ytimg.com%2Fvi%2FR4mnsA5dctU%2Fsddefault.jpg)