Upload date
All time
Last hour
Today
This week
This month
This year
Type
All
Video
Channel
Playlist
Movie
Duration
Short (< 4 minutes)
Medium (4-20 minutes)
Long (> 20 minutes)
Sort by
Relevance
Rating
View count
Features
HD
Subtitles/CC
Creative Commons
3D
Live
4K
360°
VR180
HDR
2,058 results
In this video, we'll go through 10 real-world Bokeh examples to help you master interactive data visualization with Python.
268 views
2 weeks ago
Visualizing data helps you understand it faster, and Matplotlib is one of the best Python tools for making charts. In this video, Lead ...
1,743 views
In Part 2 of this Data Visualization with Python Course 2026, you will learn how to visualize data distributions, relationships, and ...
95 views
7 days ago
Most people look at data… Smart people see patterns. And professionals? They visualize data. In this video, you'll learn what ...
67 views
12 days ago
Matplotlib Basics: Create Charts (line, scatter, bar) + labels + saving AI Disclosure & Credits Content Source: This video was ...
5 views
8 days ago
8 views
4 days ago
Learn how to use QueryChat to add natural language querying to your Python data applications. This tutorial shows you how to let ...
988 views
4 weeks ago
In Part 3 of this Data Visualization with Python Course 2026, you will create categorical, advanced statistical, and geospatial ...
45 views
2 days ago
0 views
3 weeks ago
CSV Data can be found here: https://catalog.data.gov/dataset/electric-vehicle-population-data.
42 views
Learn the fundamentals of Data Visualization in Plotly! In this tutorial, we'll explore key concepts, create interactive charts, and ...
2 views
In this video, we step away from the terminal and into the world of data visualization. We'll use BioPython to analyze a sequence ...
62 views
LifeClock is a Python application that generates a powerful visual representation of your life as a grid of weeks — each square ...
31 views
Testing ChatGPT for code generation, statistics and visual analytics. This experiment compared GPT responses to an authoritative ...
1 view
In Ep 11 of our Python Data Analysis series, we learn how to visualize data using Matplotlib. After cleaning and exploring data ...
SKEE1033 Scientific Programming Group 2.
Welcome back to Summarized AI ! If you're working with data in Python—whether it comes from CSV files, Excel sheets, ...
Task 4: Data Visualization Using Python | Matplotlib & Seaborn In this video, I have completed Task 4: Data Visualization as part ...
7 views
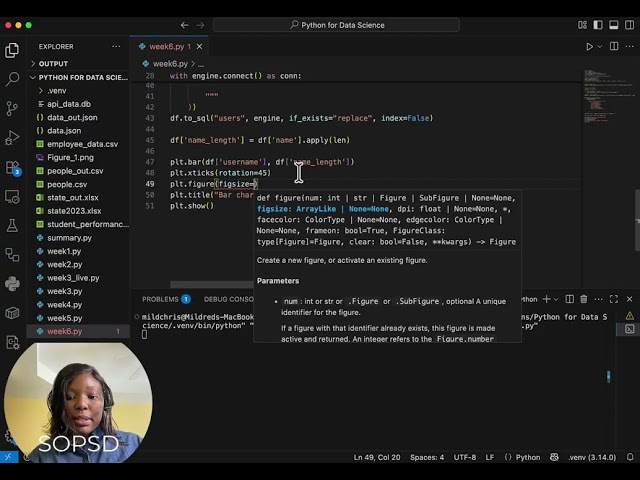
School of Programming and Software Development sop-AI-101: Python for Data Science This lesson introduces students to ...
23 views
Discover how to unlock powerful data insights using just a single line of Python code with D-Tale. This video dives into how ...
231 views
What if your charts could explain themselves — to everyone? In this episode of Call the API, we tackle one of the most overlooked ...
... to essential programming concepts, including functions, iteration, decision-making structures, and data visualization techniques.
4 views
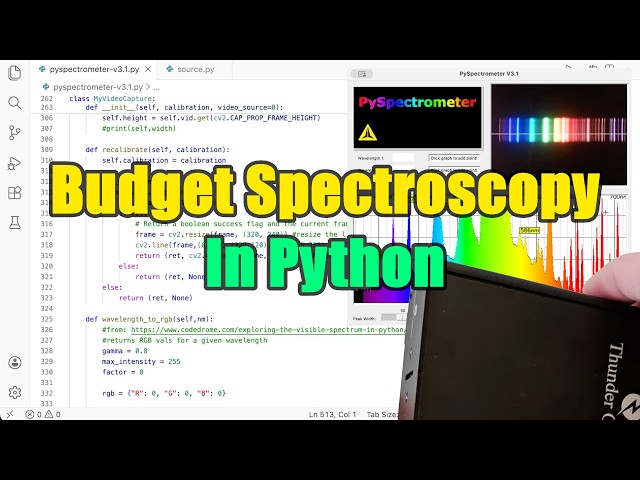
In this video, I show how to work with a USB spectrometer in Python, from device connection to high-resolution spectral analysis.
280 views
0:00 Introduction 0:03 Basics of Data Visualization 1:28 Coding Session 8:02 Conclusion In this video, we explain data ...


![Data Visualization with Python Course [2026] - Part 2: Distribution & Time Series Charts](/api/proxy/image?url=https%3A%2F%2Fi.ytimg.com%2Fvi%2Ftaa64u_CcYk%2Fsddefault.jpg)


![Data Visualization with Python Course [2026] - Part 3: Categorical, Statistical & Geospatial Charts](/api/proxy/image?url=https%3A%2F%2Fi.ytimg.com%2Fvi%2FR4mnsA5dctU%2Fsddefault.jpg)