Upload date
All time
Last hour
Today
This week
This month
This year
Type
All
Video
Channel
Playlist
Movie
Duration
Short (< 4 minutes)
Medium (4-20 minutes)
Long (> 20 minutes)
Sort by
Relevance
Rating
View count
Features
HD
Subtitles/CC
Creative Commons
3D
Live
4K
360°
VR180
HDR
10,005 results
python #coding #matplotlib In this video we will create a basic histogram using Matplotlib.
10,338 views
9 months ago
python #coding #matplotlib This video will give you an introduction to customizing plots with Matplotlib. In the next video, we will ...
12,552 views
python #coding #matplotlib Matplotlib is a Python library used for data visualization. It provides a MATLAB-like interface for quick ...
40,333 views
python #coding #matplotlib In this video I will show you how to create subplots using Matplotlib.
13,216 views
Learn how to use Matplotlib in Python to create both line plots (plt.plot) and scatter plots (plt.scatter) step by step. In this ...
123 views
10 months ago
python #coding #matplotlib In this video we will create a simple bar chart using matplotlib.
10,515 views
python #coding #matplotlib In this video I will demonstrate how to create titles and labels in Matplotlib.
10,497 views
Online CBSE Tuition & Doubt Clarification Sessions for Class 11 & 12 – Computer Science & Informatics Practices Contact: ...
1,230 views
7 months ago
En este video aprenderás como instalar la librería matplotlib en python. Se muestra cómo usar el comando pip para instalar ...
2,205 views
python #coding #matplotlib In this video we will create a basic scatter plot using Matplotlib. Here is some sample data you can ...
11,228 views
python #coding #matplotlib This video serves as a project where we will create a bar chart based on the primary Type of the ...
10,527 views
Get up to 75% off VPS at Hostinger to self-host your own Clawdbot. with code CODEHEAD10 for an extra discount at ...
4,887 views
4 months ago
Visualizing data helps you understand it faster, and Matplotlib is one of the best Python tools for making charts. In this video, Lead ...
2,520 views
5 months ago
Matplotlib is powerful — but many developers struggle once they go beyond a simple plot. In this video, you'll unlock Matplotlib ...
290 views
6 months ago
Our intro to Matplotlib in Python, focusing on how to turn raw data into beautiful plots. We start by creating basic plots, then builds ...
8,048 views
3 months ago
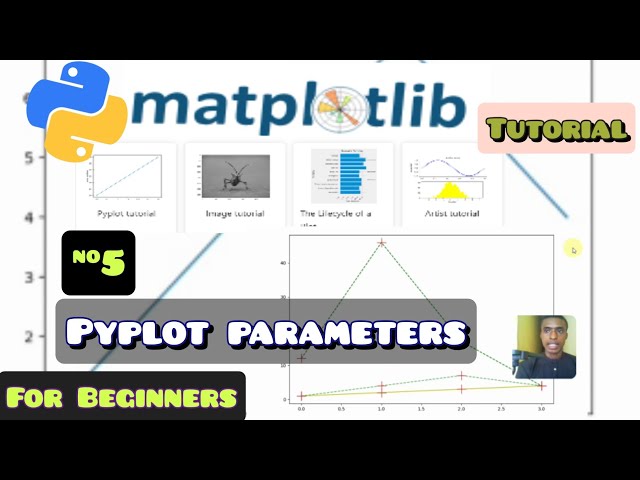
In this chapter of the Matplotlib Tutorial Series, we dive deep into the pyplot.plot() function — one of the most powerful tools in ...
4 views
8 months ago
162 views
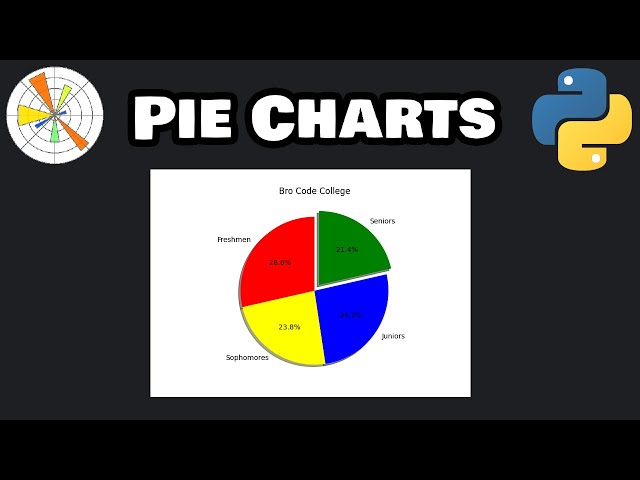
python #coding #matplotlib In this video we will create a basic pie chart using Matplotlib.
10,671 views
Data Visualization - introduction to matplotlib.
24 views
11 months ago
Python Code: import matplotlib.pyplot as plt x = [1, 2, 3, 4, 5] y = [1, 4, 9, 16, 25] plt.plot(x, y, linewidth=3, marker='+', color='green') ...
26,386 views