Upload date
All time
Last hour
Today
This week
This month
This year
Type
All
Video
Channel
Playlist
Movie
Duration
Short (< 4 minutes)
Medium (4-20 minutes)
Long (> 20 minutes)
Sort by
Relevance
Rating
View count
Features
HD
Subtitles/CC
Creative Commons
3D
Live
4K
360°
VR180
HDR
69 results
This is a brief demo and overview of plotly studio, a desktop app relying on LLMs to generate data dashboards from user prompts.
24 views
5 days ago
1 view
2 weeks ago
Learn the fundamentals of Data Visualization in Plotly! In this tutorial, we'll explore key concepts, create interactive charts, and ...
0 views
3 days ago
Learn how to build Interactive Dashboards in Python using Plotly. In this tutorial, I compare Plotly vs Matplotlib and show you why ...
80 views
3 weeks ago
Discover how to unlock powerful data insights using just a single line of Python code with D-Tale. This video dives into how ...
140 views
2 days ago
ADULT CENSUS INCOME DASHBOARD | Complete Data Science Project In this video, I walk you through my complete data ...
12 views
8 days ago
Training machine learning models doesn't have to be complicated or time-consuming. This video shows how to use AutoGluon, ...
320 views
4 weeks ago
In Part 6 of this Python Pandas Course for Data Analytics 2026, you will learn how to prepare data for machine learning and ...
145 views
Just wrapped up a project I'm really excited to share — a full-stack Urban Air Quality ...
5 views
In Part 5 of this Python Pandas Course for Data Analytics 2026, you will work with time series data in pandas. You will learn date ...
83 views
11 days ago
Testing ChatGPT for code generation, statistics and visual analytics. This experiment compared GPT responses to an authoritative ...
9 days ago
Ces sources constituent un guide technique complet sur Dash, un cadre de travail Python permettant de concevoir des tableaux ...
7 views
10 days ago
Build a jaw-dropping futuristic medical dashboard in Streamlit in just 9 minutes! Full sci-fi HUD style: neon glow, glassmorphism ...
10 views
NumPy itself does not create graphs, but it is the foundation for data visualization in Python. Visualization libraries like Matplotlib, ...
In this final installment of our series on data analysis with ChatGPT, Brandon Krakowsky, Director of Data Science & Research at ...
111 views
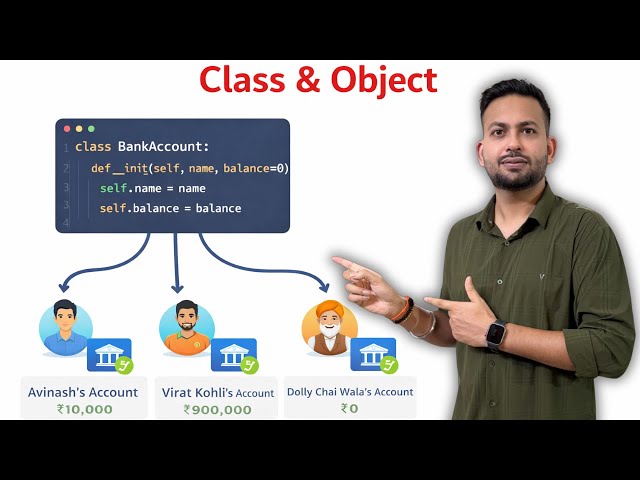
In this video, we explain Object-Oriented Programming (OOP) in Python using a real-world banking system example. You'll learn ...
159 views
Master Data Visualization in 2026 | 5 Essential Techniques Learn the 5 most powerful data visualization techniques that every ...
33 views
Bring your data applications to life! 🚀 In this tutorial, we'll learn how to overcome the limitations of Streamlit's standard ...
216 views
6 days ago
In this video, I walk through a quantitative finance application I built to automate stock volatility analysis and risk assessment.


![Python Pandas Course for Data Analytics [2026] - Part 6: Encoding, Scaling & Feature Engineering](/api/proxy/image?url=https%3A%2F%2Fi.ytimg.com%2Fvi%2FuiFV_QQMT04%2Fsddefault.jpg)

![Python Pandas Course for Data Analytics [2026] - Part 5: Working With Time Series Data & Dates](/api/proxy/image?url=https%3A%2F%2Fi.ytimg.com%2Fvi%2F0gW6RVh-_Tg%2Fsddefault.jpg)