Upload date
All time
Last hour
Today
This week
This month
This year
Type
All
Video
Channel
Playlist
Movie
Duration
Short (< 4 minutes)
Medium (4-20 minutes)
Long (> 20 minutes)
Sort by
Relevance
Rating
View count
Features
HD
Subtitles/CC
Creative Commons
3D
Live
4K
360°
VR180
HDR
2,700 results
In this Plotly Express tutorial, we'll show you how to use Plotly to create professional graphs in minutes! GitHub Link: ...
11,200 views
2 years ago
Colab Notebook: https://colab.research.google.com/drive/1wxI23X7EzV2-DlWU7F0iIeTSTV2OPYTy?usp=sharing Thank you for ...
37,254 views
4 years ago
Overview: Want to turn your data into dynamic, interactive visuals with just a few lines of Python? In this beginner-friendly episode, ...
412 views
8 months ago
Data visualization is an import part of working with data and Python has many libraries that allow you to display a wide range of ...
8,084 views
In this comprehensive tutorial, learn how to create stunning bar charts using Python and Plotly Express. Perfect for data scientists, ...
166 views
1 year ago
Data visualization is an important part of working with data and Python has many libraries that allow you to display a wide range of ...
11,490 views
Timestamps: 00:00 Introduction 00:33 Matplotlib 02:46 Seaborn 05:10 Bokeh 07:50 Plotly Express 11:40 Plotnine 13:02 Altair ...
109,125 views
Este tutorial es introductorio para mostrar ejemplos de gráficos que se pueden hacer a partir de un set de datos de alto volumen.
2,053 views
5 years ago
Create Stunning Filled Area Plots with Plotly & Pandas! Unlock the power of data visualization! In this Just Code It tutorial, you'll ...
75 views
10 months ago
This tutorial is an introduction to Sunburst charts on Plotly Express. Plotly Express is a data visualizaiton library in Python that ...
1,893 views
3 years ago
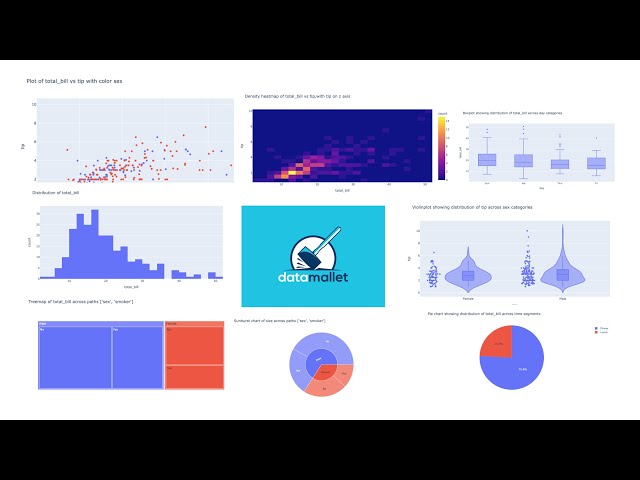
In this video, I show you how to perform automatic data visualization in under 10 lines of code using datamallet.
1,768 views
Full code here: https://github.com/thefullstackninja/plotly_express_tutorial Book a session with me on Wyzant to get 1 on 1 ...
6,818 views
Pedro Manuel Ramos Rodríguez en PyBirras Tenerife 2019 Plotly Express es una librería de visualización de datos de alto nivel ...
144 views
6 years ago
hello, in this video, we test run plotly express. which is a high level interface wrapped around plotly. this means less code and ...
1,079 views
Hello brilliant community! 🌟 Thank you so much for tuning in to our video. 🙌 The fun doesn't stop here! Discover more of our ...
475 views
Plotly ist ein modernes Tool mit vielfältigen Einsatzmöglichkeiten: Von einfachen, explorativen Grafiken bis hin zu hochkomplexen ...
1,098 views
Heatmaps, also known as Density Maps, are data visualisations that display the spatial distribution of a variable across a ...
8,706 views
In this video im will show you how you can create a simple bar chart, just a simple one, and customize it to look better.
484 views
In this tutorial, we will walk you through creating an interactive geographical scatter plot using Plotly Express in Python. We'll use ...
Support: https://www.buymeacoffee.com/protopinez Kaggle Example: ...
204 views
6 views
This video will help to learn how to analyze data with different charts with plotly.
1 view
Plotly express, Interactive, beautiful and easy to use Graphs Let's see how we can use this library. If you find this video useful don't ...
6,499 views
In this video, I walk you through how to create violinplots using the FreeCharts tool. Check out the data visualization tool I ...
52 views
the description --------------- plotly express is fast and light weight plotly graph objects is more complete plotly.express (px): ...
13 views


![[Pablo Paniagua] Visualizando datos con Plotly Express y Python](/api/proxy/image?url=https%3A%2F%2Fi.ytimg.com%2Fvi%2F_4oZK5wQXjQ%2Fsddefault.jpg)