ViewTube

ViewTube
Sign inSign upSubscriptions
Filters

Upload date

Type

Duration

Sort by

Features

Reset

454 results

Bro Code
Start using Matplotlib in 7 minutes! 📊

python #coding #matplotlib Matplotlib is a Python library used for data visualization. It provides a MATLAB-like interface for quick ...

7:02
Start using Matplotlib in 7 minutes! 📊

21,357 views

3 months ago

ProgrammingKnowledge2
How to Install Matplotlib in VS Code on Mac (2025) | Python Graphs & Charts Setup Guide

Want to create stunning charts and plots using Python on your Mac? In this easy and updated 2025 guide, I'll show you how to ...

5:21
How to Install Matplotlib in VS Code on Mac (2025) | Python Graphs & Charts Setup Guide

194 views

6 months ago

Data Geek is my name
Visualize Your Data in Python (Beginner Tutorial 2025) | Matplotlib + Seaborn Step-by-Step

Learn how to visualize your data in Python using Matplotlib and Seaborn! This beginner-friendly tutorial walks you through ...

8:37
Visualize Your Data in Python (Beginner Tutorial 2025) | Matplotlib + Seaborn Step-by-Step

138 views

1 month ago

Using STEM
Start Your AI Journey in 15 Minutes: Python, VS Code & Libraries Setup

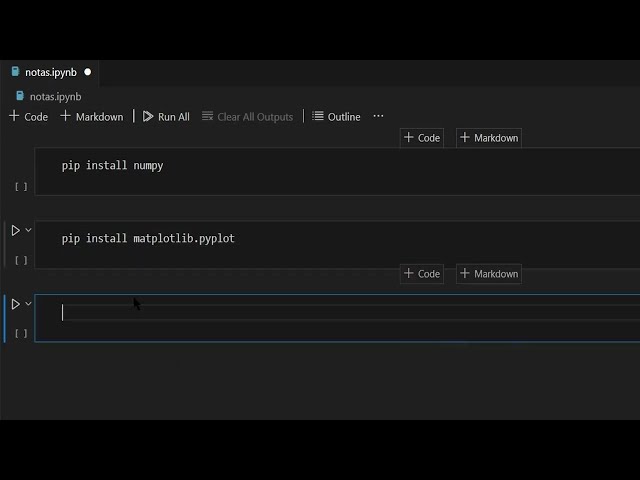
Start Your AI Journey in 15 Minutes: Python, VS Code & Libraries Setup Description.

15:50
Start Your AI Journey in 15 Minutes: Python, VS Code & Libraries Setup

52 views

5 months ago

José Cruz Muñoz Esparza
Estadística con python usando Visual Studio Code
6:10
Estadística con python usando Visual Studio Code

65 views

10 months ago

Programming with Abe
Analyzing 982K Crime Reports using Python || Pandas, NumPy, & Matplotlib

In this video, I explore 982639 real U.S. crime reports from January 2020 to September 2024 using Python, Pandas, NumPy, and ...

6:21
Analyzing 982K Crime Reports using Python || Pandas, NumPy, & Matplotlib

11 views

2 months ago

NDC
Python for Beginners #6: Visualize Data with Python (Matplotlib & Pandas Tutorial)

Visualize your data with Python! Learn the basics of creating beautiful charts and graphs using Matplotlib and Pandas.

13:16
Python for Beginners #6: Visualize Data with Python (Matplotlib & Pandas Tutorial)

29 views

9 months ago

VulnHunt
How to Setup Python & Matplotlib in VS Code 2025 || #vscode #matplotlib #python

Welcome to VulnHunt! In this video, you will learn how to set up Python in VS Code and create beautiful graphs using the ...

4:59
How to Setup Python & Matplotlib in VS Code 2025 || #vscode #matplotlib #python

110 views

7 months ago

Data Geek is my name
How to Save Charts in Python (Matplotlib + Seaborn) | Export PNG, JPG, PDF in VS Code

Learn how to save your Python charts the right way using Matplotlib and Seaborn inside VS Code with Jupyter Notebook. In this ...

5:46
How to Save Charts in Python (Matplotlib + Seaborn) | Export PNG, JPG, PDF in VS Code

69 views

3 weeks ago

ChipmunkRPA
CPA Coders - Course #161 -  Intro to Matplotlib

Course #161 - Intro to Matplotlib.

4:49
CPA Coders - Course #161 - Intro to Matplotlib

3 views

5 months ago

datapartnership
How to run a code in VS Code in a simple way. #dataanalytics #datavisualization

This video might be helpful for beginners or non-programmer. Please refer this video also: ...

9:27
How to run a code in VS Code in a simple way. #dataanalytics #datavisualization

7 views

3 months ago

DeepVisionH2M
Cómo crear un entorno virtual en Windows con Python y usarlo en VSCode

Estás empezando con Python y quieres organizar tus proyectos correctamente? En este video te enseño paso a paso cómo crear ...

5:26
Cómo crear un entorno virtual en Windows con Python y usarlo en VSCode

322 views

6 months ago

Kayla Shafa Maulida
Analisis XRD : Visual Studio Code (Extension : Python, Matplotlib) | Karakterisasi Senyawa Anorganik
17:53
Analisis XRD : Visual Studio Code (Extension : Python, Matplotlib) | Karakterisasi Senyawa Anorganik

2 views

6 months ago

The Art of Intelligence
[Python - 19] Python Virtual Environment & Module Design in VS Code [Complete Setup & Best Practices

In this tutorial, you'll learn how to properly structure a Python data visualization project in Visual Studio Code (VS Code) using a ...

14:17
[Python - 19] Python Virtual Environment & Module Design in VS Code [Complete Setup & Best Practices

239 views

8 months ago

ChipmunkRPA
CPA Coders - Course #163 - Matplotlib - LinePlot

Course #163 - Matplotlib - LinePlot.

4:49
CPA Coders - Course #163 - Matplotlib - LinePlot

0 views

5 months ago

Data with Baraa
Python vs Power BI: Tools or Code for Data Visualization? How I Decide

Visually explained breakdown of Python vs Power BI for data visualization, showing when to use code and when to use tools.

4:11
Python vs Power BI: Tools or Code for Data Visualization? How I Decide

17,826 views

6 months ago

DailyAIWizard
Day 41: Matplotlib for Data Visualization – Beginner’s Guide for AI Coding | #DailyAIWizard

Wizards, join Anastasia, Isabella, Ethan, Sophia, and Olivia for Day 41 of the DailyAIWizard Python for AI series! Master ...

19:31
Day 41: Matplotlib for Data Visualization – Beginner’s Guide for AI Coding | #DailyAIWizard

15 views

4 months ago

a_pat_of_butter
Excel_Python: Matplotlib(4):VSCode pandas

Excel_python, Python, Excel, Excel in Pathon, Matpulotlib, Pandas, 可視化、 データの傾向が分かれば、機械学習モデルの選択等 ...

5:53
Excel_Python: Matplotlib(4):VSCode pandas

10 views

3 weeks ago

CodeDock
How to Get Apple Stock Market Trends Using Python & Yahoo Finance API 📈 (Step-by-Step)

Want to analyze stock market trends using Python? In this quick tutorial, I'll show you how to fetch and visualize Apple's (AAPL) ...

4:28
How to Get Apple Stock Market Trends Using Python & Yahoo Finance API 📈 (Step-by-Step)

78 views

11 months ago

EduTech2001
Create a Stunning 3D Black Hole Visualization in Python | AI + VS Code Tutorial | EduTech2001

Learn how to create a realistic 3D Black Hole Representation in Python using AI tools and VS Code! In this step-by-step tutorial, ...

9:46
Create a Stunning 3D Black Hole Visualization in Python | AI + VS Code Tutorial | EduTech2001

112 views

3 months ago