Upload date
All time
Last hour
Today
This week
This month
This year
Type
All
Video
Channel
Playlist
Movie
Duration
Short (< 4 minutes)
Medium (4-20 minutes)
Long (> 20 minutes)
Sort by
Relevance
Rating
View count
Features
HD
Subtitles/CC
Creative Commons
3D
Live
4K
360°
VR180
HDR
14,801 results
Example code: https://rebrand.ly/kg1qk17 Chapters 00:00 - Intro to Matplotlib 00:29 - Install Matplotlib 00:35 - Import pyplot ...
6,266 views
11 months ago
python #coding #matplotlib Matplotlib is a Python library used for data visualization. It provides a MATLAB-like interface for quick ...
19,931 views
2 months ago
Domina los gráficos 3D en Python con Matplotlib! ¿Quieres llevar tus visualizaciones al siguiente nivel? En este video, te ...
252 views
10 months ago
In this video, I'll show you how to download and install Matplotlib in PyCharm and use it to create basic data visualizations ...
35 views
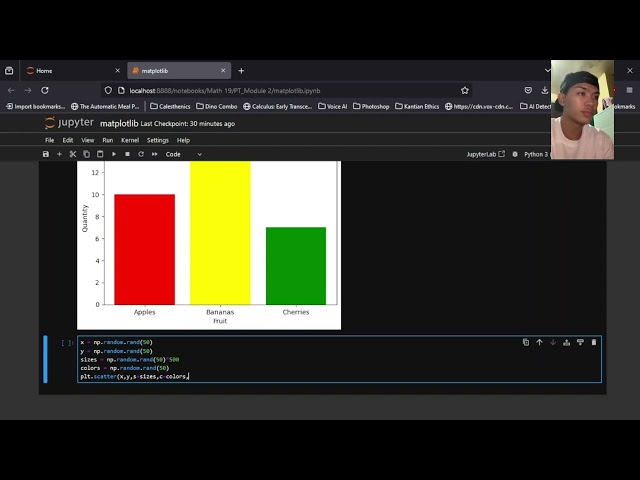
Python Code: import matplotlib.pyplot as plt x = [1, 2, 3, 4, 5] y = [1, 4, 9, 16, 25] plt.plot(x, y, linewidth=3, marker='+', color='green') ...
7,334 views
1 month ago
In this video, we'll create a simple line graph in Python using Matplotlib to visualize global temperature changes from 1880 to ...
86 views
7 months ago
python #coding #matplotlib In this video I will show you how to create subplots using Matplotlib.
6,449 views
"Mastering Matplotlib: The Ultimate Python Data Visualization Guide" Description: Welcome to the Ultimate Matplotlib ...
30 views
8 months ago
n this video, I'll show you step-by-step how to customize graphs in Matplotlib — one of the most important libraries for data ...
12 views
Master Matplotlib for your next data science interview! This comprehensive tutorial covers everything you need to know about ...
110 views
3 months ago
In this video, learn how to install matplotlib on Windows. We will also install Python 3 and pip. PIP is used to install and manage ...
624 views
3 weeks ago
Mrs. Kanchan Ashish Khedikar Assistant Professor Department of Computer Science and Engineering Walchand Institute of ...
89 views
4 months ago
Learn Matplotlib in Python — the most powerful library for data visualization! In this video, we'll cover: ✓ What is Matplotlib and ...
14 views
2,143 views
5 views
If you work with data in Python, at some point you'll need to visualize it. In this video, I'll show you the differences ...
1,523 views
#video_tags matplotlib,python plotting,customize plots,matplotlib tutorial,data visualization,python data visualization,plot ...
32 views
Welcome to ClassKarlo! In this tutorial, we'll dive into Matplotlib, the most widely used Python library for data visualization.
0 views
This is Part 2 of my Matplotlib tutorial series for data visualization using Python. In this advanced tutorial, we walk through how to ...
1,157 views
Unlock the power of Histograms in Python using Matplotlib and Seaborn! Learn to create, customize, and interpret histograms ...
59 views


![How to Install Matplotlib with latest Python 3.14 on Windows 10/11 [2025 Update] Matplotlib Tutorial](/api/proxy/image?url=https%3A%2F%2Fi.ytimg.com%2Fvi%2FJqTjyPhRHMw%2Fsddefault.jpg)