Upload date
All time
Last hour
Today
This week
This month
This year
Type
All
Video
Channel
Playlist
Movie
Duration
Short (< 4 minutes)
Medium (4-20 minutes)
Long (> 20 minutes)
Sort by
Relevance
Rating
View count
Features
HD
Subtitles/CC
Creative Commons
3D
Live
4K
360°
VR180
HDR
140 results
In this video, you'll learn how to change the color palette in your Matplotlib charts—a simple way to improve the aesthetics ...
22 views
6 days ago
FREE EXCLUSIVE WORKSHOP ALERT! CLICK HERE TO JOIN THE MEETING FOR FREE: ...
13 views
9 hours ago
Welcome to the Matplotlib Hands-On Coding Workshop! In this session, we will learn data visualization from scratch using Python ...
8 views
Learn how to create stunning hand-drawn sketch style plots in Matplotlib that make your research figures stand out!
0 views
2 days ago
In this video, you'll learn how to visualize programming language popularity trends using Python and Matplotlib. We plot ranking ...
4 days ago
sayyednasarali #DataVisualization #Python #Matplotlib #Seaborn #DataScience #BeginnerPython #SchoolLevel #PythonTutorial ...
47 views
5 days ago
In this Matplotlib python Tamil tutorial, we will learn how to visualize time series data using Pandas Series and Matplotlib step by ...
43 views
7 days ago
Welcome to Part 1 of our Data Visualization with Matplotlib series! In this video, we will understand what data visualization is, why ...
12 views
Online CBSE Tuition & Doubt Clarification Sessions for Class 11 & 12 – Computer Science & Informatics Practices Contact: ...
23 views
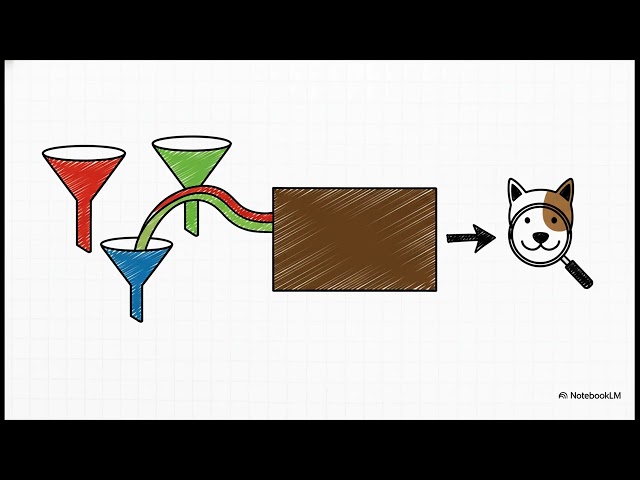
These educational documents introduce the fundamentals of image processing and computer vision using Google Colab.
9 views
Get started with data analysis in Python using Jupyter Notebook! This tutorial introduces essential libraries — NumPy, pandas, ...
Generative AI https://www.youtube.com/playlist?list=PLLOxZwkBK52DbrnYEhNQHjDrtJeqlmAeH R PROGRAMMING ...
138 views
8 hours ago
In this MizuFlow.ai Foundation of Finance episode, Sung Lee, CFA, CPA, CA, provides an extensive overview of the foundational ...
Machine Learning for Beginners in Arabic. تعلم الآلة (الذكاء الاصطناعي) دورة كاملة Learn how to use the "plot" function to create 2D ...
NumPy itself does not create graphs, but it is the foundation for data visualization in Python. Visualization libraries like Matplotlib, ...
In this video, we cover simple linear regression using Python, one of the most fundamental machine learning techniques. Simple ...
5 views
4 views
This is Part 2 of our Matplotlib Data Visualization series! In this video, we explore all major plot types that you will use in Python ...
10 views
GitHub Repo Link: https://github.com/mohammadijoo/Ruby_Plot.
7 views