ViewTube

ViewTube
Sign inSign upSubscriptions
Filters

Upload date

Type

Duration

Sort by

Features

Reset

1,207 results

Mi camino Quant
Matplotlib y Plotly en Python: Gráficas Financieras desde Cero | Mi Camino Quant

Una imagen vale más que 1000 filas de datos. En análisis cuantitativo visualizar bien es tan importante como calcular bien.

14:38
Matplotlib y Plotly en Python: Gráficas Financieras desde Cero | Mi Camino Quant

26 views

2 weeks ago

Colleen Spiegel
Why Python Took Over Data Science (And How It Compares to MATLAB & R)

There are many programming languages used for data analysis, including Python, MATLAB, R, C++, and Java. In this video, we ...

5:04
Why Python Took Over Data Science (And How It Compares to MATLAB & R)

3 views

13 days ago

code io - Tamil
Introduction to Matplotlib | Ep-1 Matplotlib | Python for AI DS | code io - Tamil

Actual Video starts at : 3:03 Google Colab : https://colab.research.google.com/ Follow us on Instagram code io ...

14:10
Introduction to Matplotlib | Ep-1 Matplotlib | Python for AI DS | code io - Tamil

1,071 views

4 weeks ago

Elhaine Daniel
Exploring the Basics of MatPlotLib Library in Python

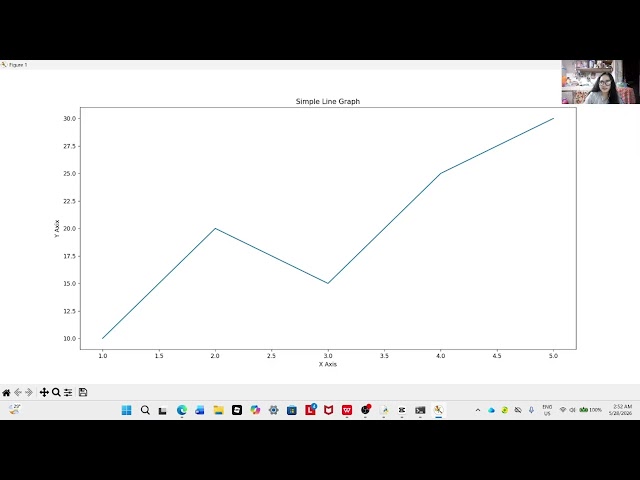
This video talks about the Matplotlib capabilities, and applying it into a simple, working program that makes a line graph ...

11:09
Exploring the Basics of MatPlotLib Library in Python

3 views

12 days ago

David Arenas R
No more invisible graphics: Master line thickness in Python 📏🐍

Is your data getting lost on the screen? Learn how to control line width in Matplotlib to emphasize the metrics that truly ...

4:01
No more invisible graphics: Master line thickness in Python 📏🐍

2 views

4 weeks ago

NARVAEZ, JULIA L.
Matplotlib Tutorial for Beginners: Learn Data Visualization in Python
13:22
Matplotlib Tutorial for Beginners: Learn Data Visualization in Python

4 views

13 days ago

ALUB, SOPHIA GUADALUPE L.
MATPLOTLIB Instructional Video | Alub, Sophia Guadalupe L.

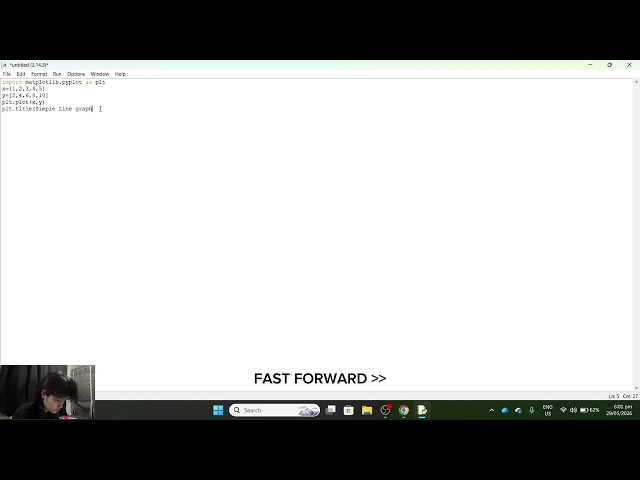
In this video, I explain: • What Matplotlib is • Creating graphs using plt.plot() • Adding titles and labels Tools Used: • Python ...

9:11
MATPLOTLIB Instructional Video | Alub, Sophia Guadalupe L.

20 views

2 weeks ago

AI- ON Self
Python Is Not a Snake.Using Python Libraries like NumPy & Matplotlib in AI Engineering

Welcome back to AI-ON Self System channel. In this video, I share how I used Python libraries like NumPy and Matplotlib during ...

4:10
Python Is Not a Snake.Using Python Libraries like NumPy & Matplotlib in AI Engineering

18 views

4 weeks ago

Mathew K Analytics
Master Matplotlib: Essential Techniques for Effective Statistical Data Visualization

Unlock the power of Matplotlib with our step-by-step tutorial designed to boost your data visualization skills! Whether you're a ...

14:45
Master Matplotlib: Essential Techniques for Effective Statistical Data Visualization

26 views

2 weeks ago

Cave of Programming
How Python Became the Language of AI

Python Mastery Bundle: https://caveofprogramming.thinkific.com/bundles/python-mastery-bundle A complete path from ...

17:12
How Python Became the Language of AI

804 views

2 weeks ago

Simple App
Every Python Library | Explained in 8 Minutes

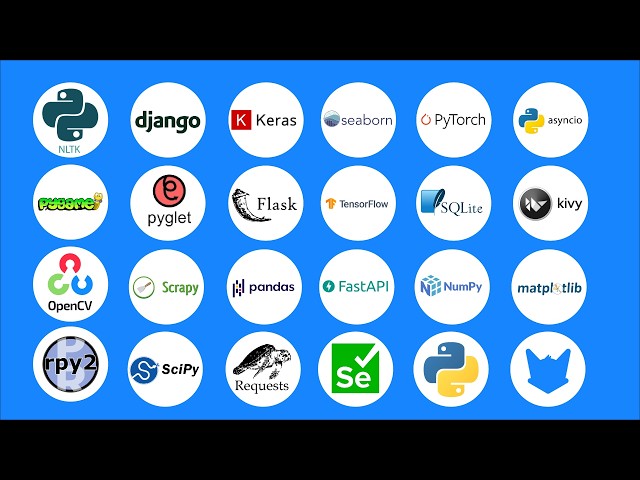
There are over 5,000 libraries in Python, but today we're going to use a real-world project to discover the 22 most commonly ...

8:30
Every Python Library | Explained in 8 Minutes

133 views

2 weeks ago

Vision Metrics DPV:
PYTHON-Crea tu PRIMER gráfico en Python con Matplotlib en minutos

En este video aprenderás cómo crear tus primeros gráficos en Python usando Matplotlib y Pandas de una forma súper fácil y ...

10:45
PYTHON-Crea tu PRIMER gráfico en Python con Matplotlib en minutos

53 views

2 weeks ago

Kyla Napiza
Using Matplotlib Library in Python

coding #python #numpy #statistics In this video, understand matplotlib in a simple way. ~Graphs.

8:49
Using Matplotlib Library in Python

6 views

3 weeks ago

Mathew K Analytics
Master Styling, Annotations & Saving Techniques for Python Data Visualization

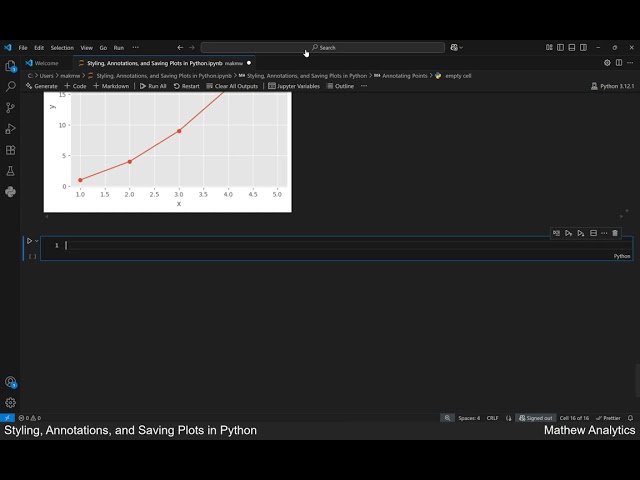
Want to take your Python data visualization skills to the next level? In this video, you'll learn how to style your plots, add impactful ...

12:39
Master Styling, Annotations & Saving Techniques for Python Data Visualization

2 views

10 days ago

MILLARES, MARSHA LAINE V.
Learn Matplotlib in Python | Simple Demo & Overview

Discover how Matplotlib helps create graphs and charts in Python for easier data visualization and analysis. #Python ...

14:23
Learn Matplotlib in Python | Simple Demo & Overview

47 views

2 weeks ago

OnlineITGuru
AI & ML Basics 2026 | Data Visualization in Python | Implement Matplotlib and Analyzing Datasets

AI & ML Basics 2026 | Data Visualization in Python | Implement Matplotlib and Analyzing Datasets Join our full course now at: ...

10:12
AI & ML Basics 2026 | Data Visualization in Python | Implement Matplotlib and Analyzing Datasets

0 views

9 days ago

Learn Computer Science with Prof. Rashi
Visualize Satellite NDVI Data in Python with Rasterio &Matplotlib | Anaconda Setup

GIS Lab Practical 2 is here! In this video, we open a real satellite image (.tif file), read its pixel values, and render it as a ...

10:26
Visualize Satellite NDVI Data in Python with Rasterio &Matplotlib | Anaconda Setup

26 views

3 weeks ago

CS Brain
MatPlotLib Crash Course - Python Data Visualization

Learn MatPlotLib fundamentals and build a strong coding foundation. Perfect for beginners interested in AI, machine learning, and ...

10:02
MatPlotLib Crash Course - Python Data Visualization

35 views

2 weeks ago

Study Hacks-Institute of GIS & Remote Sensing
Python Mapping & Data Visualization | How to Highlight Boundaries Using Python

Learn how to perform Mapping and Data Visualization using Python and discover how to highlight geographic boundaries for GIS ...

6:57
Python Mapping & Data Visualization | How to Highlight Boundaries Using Python

130 views

3 weeks ago

Casselle Duro
MatPlotLib Library in Python
8:26
MatPlotLib Library in Python

11 views

12 days ago