Upload date
All time
Last hour
Today
This week
This month
This year
Type
All
Video
Channel
Playlist
Movie
Duration
Short (< 4 minutes)
Medium (4-20 minutes)
Long (> 20 minutes)
Sort by
Relevance
Rating
View count
Features
HD
Subtitles/CC
Creative Commons
3D
Live
4K
360°
VR180
HDR
188,225 results
Example code: https://rebrand.ly/kg1qk17 Chapters 00:00 - Intro to Matplotlib 00:29 - Install Matplotlib 00:35 - Import pyplot ...
8,733 views
1 year ago
► The PYTHON package matplotlib 📊 allows you to create basic visualizations in a simple way. In this video, we'll see how to ...
81,513 views
5 years ago
In this video we learn how to visualize 3D plots in Matplotlib. ◾◾◾◾◾◾◾◾◾◾◾◾◾◾◾◾◾ Programming Books ...
145,002 views
4 years ago
python #coding #matplotlib Matplotlib is a Python library used for data visualization. It provides a MATLAB-like interface for quick ...
24,035 views
4 months ago
Learn matplotlib in this data science programming tutorial. Learn how to plot line graphs and histograms in Python using the ...
191,236 views
6 years ago
Today we learn a fundamental data science skill. We learn how to animate plots using Matplotlib in Python.
197,703 views
In this video tutorial, you will learn how to make multiple line graph in Python using Matplotlib. You will learn how to filter and ...
1,927 views
Learn to plot graphs in Python in this tutorial! We cover matplotlib and show you how to get an awesome looking plot. As part of ...
56,084 views
Today we learn how to make our Matplotlib visualizations interactive by using widgets.
23,578 views
2 years ago
Complete SciPy 2015 Talk & Tutorial Playlist here: http://ow.ly/PHjEN.
174,230 views
10 years ago
Our favourite plotting library may just be matplotlib again now that we made it interactive with a puck! It may sounds strange at first, ...
6,227 views
5 days ago
Master AI from Zero to Advanced: https://ailearninghub.io ------------------------- In this video, you'll learn the fundamentals of creating ...
815 views
10 months ago
Unlock the power of advanced data visualisation with Matplotlib! In this tutorial, we dive deep into heatmaps and radial ...
1,451 views
Python Code: import matplotlib.pyplot as plt x = [1, 2, 3, 4, 5] y = [1, 4, 9, 16, 25] plt.plot(x, y, linewidth=3, marker='+', color='green') ...
12,049 views
3 months ago
python #coding #matplotlib In this video I will show you how to create subplots using Matplotlib.
7,753 views
python #coding #matplotlib In this video we will create a basic histogram using Matplotlib.
6,336 views
python #coding #matplotlib In this video we will create a basic scatter plot using Matplotlib. Here is some sample data you can ...
6,807 views
python #coding #matplotlib This video will give you an introduction to customizing plots with Matplotlib. In the next video, we will ...
8,460 views
In this video, learn how to install matplotlib on Windows. We will also install Python 3 and pip. PIP is used to install and manage ...
2,319 views
2 months ago
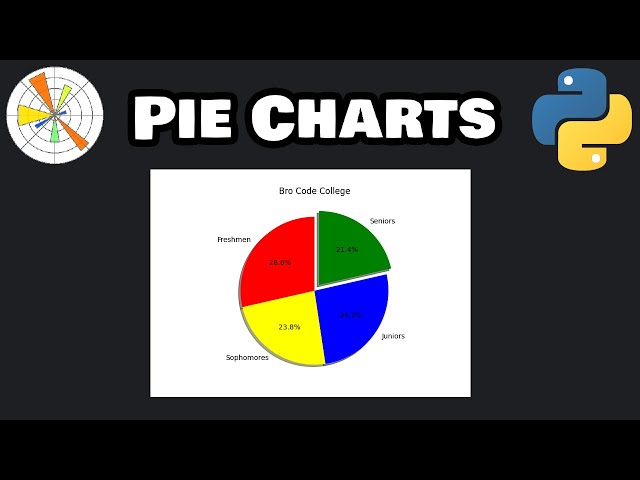
python #coding #matplotlib In this video we will create a basic pie chart using Matplotlib.
7,244 views
python #coding #matplotlib This video serves as a project where we will create a bar chart based on the primary Type of the ...
7,769 views
python #coding #matplotlib In this video we will create a simple bar chart using matplotlib.
6,108 views
notebook used in this tutorial: https://github.com/codebasics/py/blob/master/matpltlib/1_intro/1_matplotlib_introduction.ipynb ...
187,556 views
8 years ago
Visualization is central to the process of how we think. This video reviews the inner workings of Python's most popular plotting ...
3,800 views
Learn to build an interactive app with matplotlib graphs, dropdowns and tables with Plotly Dash.
15,487 views
In this video we learn how to create contour plots in Python with Matplotlib. ◾◾◾◾◾◾◾◾◾◾◾◾◾◾◾◾◾ Programming ...
4,620 views
In this video, you'll learn about customizing plots using Matplotlib. Matplotlib is essential to Machine Learning! It allows you to ...
1,581 views
In this video, we will be learning how to create histograms in Matplotlib. This video is sponsored by Brilliant.
208,085 views
In this video, we're speed-running the creation of an animated line graph visualization comparing AMD, Intel, and Nvidia stock ...
15,094 views

![How to use MATPLOTLIB to make graphs 🐍💻 [Python Data Science Course in Spanish]](/api/proxy/image?url=https%3A%2F%2Fi.ytimg.com%2Fvi%2FXEG4eh5l_qU%2Fsddefault.jpg)


![How to Install Matplotlib with latest Python 3.14 on Windows 10/11 [2025 Update] Matplotlib Tutorial](/api/proxy/image?url=https%3A%2F%2Fi.ytimg.com%2Fvi%2FJqTjyPhRHMw%2Fsddefault.jpg)