ViewTube

ViewTube
Sign inSign upSubscriptions
Filters

Upload date

Type

Duration

Sort by

Features

Reset

59 results

MUNDO IO ACADEMY - Investigación de Operaciones
Programación Lineal con Solver: Plan de Inversión con Acciones

Desarrollamos un caso propuesto del libro de "Investigación de Operaciones en la Ciencia Administrativa" de G.Eppen et. al.

9:06
Programación Lineal con Solver: Plan de Inversión con Acciones

48 views

7 days ago

Zachary Moore
DATA9100 A01 Option2

Second companion video for DATA9100_A01! Solving an outsourcing problem with a simple linear cost model.

14:36
DATA9100 A01 Option2

22 views

4 days ago

Daniel Githua Tutor
Excel Bar Charts Explained: Visualize Data Like a Pro

Learn how to create powerful bar charts in Excel that make your data pop! In this tutorial, I'll walk you through the step-by-step ...

4:11
Excel Bar Charts Explained: Visualize Data Like a Pro

6 views

7 days ago

Blue Moonshine
Finding Relationships Between Variables Using EXCEL

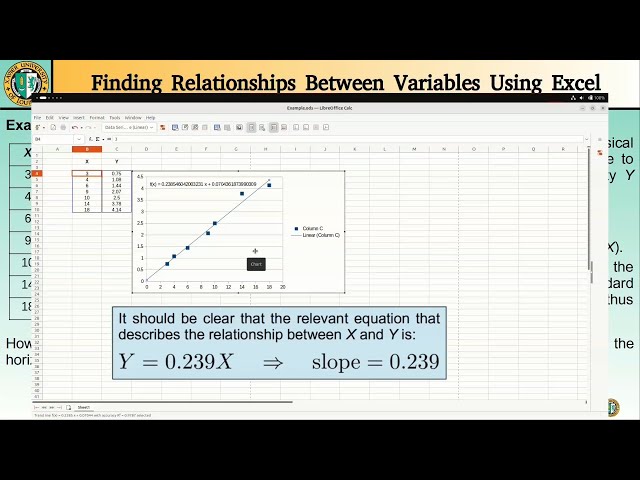
In this tutorial, you'll learn how to use spreadsheet software such as Excel to analyze experimental data and determine the ...

13:31
Finding Relationships Between Variables Using EXCEL

48 views

4 days ago

Suchi Dubey
Logistic Regression in Excel Without Coding – Using RealStats

Access the Excel file provided. The original data source is Kaggle, and the version shared on the drive has been cleaned for use.

11:12
Logistic Regression in Excel Without Coding – Using RealStats

50 views

2 days ago

10 Min For Supply Chain
Excel Demand Forecasting Tutorial | Double vs Triple Exponential Smoothing

Get this Excel ...

19:19
Excel Demand Forecasting Tutorial | Double vs Triple Exponential Smoothing

93 views

3 days ago

Phil Jarina
Beta Function BETADIST LINEST Polynomial Regression Google Sheets or Excel

Beta Function BETADIST LINEST Polynomial Regression Google Sheets or Excel.

8:49
Beta Function BETADIST LINEST Polynomial Regression Google Sheets or Excel

23 views

3 days ago

Molly-Mae Alsop
14 January 2026
14:16
14 January 2026

0 views

6 days ago

Gary Parker
MTH098 Lesson 3.4 Excel Chart

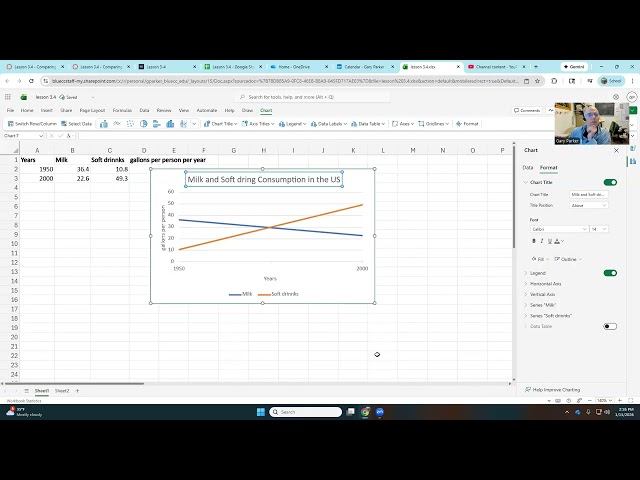
MTH098 Quantitative Literacy 2 Make a comparative line chart in Excel.

8:38
MTH098 Lesson 3.4 Excel Chart

0 views

3 days ago

Prof. Jayatra Mandal
Mann-Kendall Test + Sen’s Slope in R || Time Series Trend Detection for Scientific Journals || 2026

Link for Excel file, Image, Pdf output and R codes: ...

6:32
Mann-Kendall Test + Sen’s Slope in R || Time Series Trend Detection for Scientific Journals || 2026

30 views

3 days ago

Tanomas Creation
How to Determine Unknown Concentration from Absorbance Data in Excel | Using Standard Graph

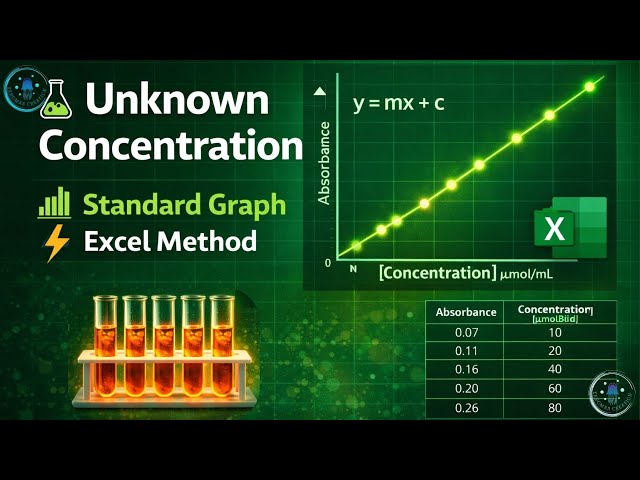
In this video, you will learn how to determine the concentration of an unknown sample using absorbance (OD) data and a ...

9:10
How to Determine Unknown Concentration from Absorbance Data in Excel | Using Standard Graph

0 views

4 days ago

FREDOLINI JUS
SHF662
9:22
SHF662

0 views

5 days ago

Ken Stirrat
Using Desmos to plot Tables and regression Lines

A short video showing you efficient ways to: plot a table of values Rescale Fit the regression Line Plot the mean.

4:47
Using Desmos to plot Tables and regression Lines

34 views

5 days ago

Assignments by Mentor
Exp25_Excel_Ch08_ML1 - Course Evaluation 1.1 | Excel Chapter 8: Grader Mid-Level 1 Course Evaluation

Exp25_Excel_Ch08_ML1_Course_Evaluation_1.1 #Course_Evaluation #Exp25ExcelCh08ML1CourseEvaluation1.1 ...

15:37
Exp25_Excel_Ch08_ML1 - Course Evaluation 1.1 | Excel Chapter 8: Grader Mid-Level 1 Course Evaluation

0 views

5 days ago

rashid computer
MS-Excel---Series And Fill Series

MS-Excel---Series And Fill Series Today I am going to tell you about " Series and Fill Series. Linear. Growth. Date. Autofill. Trend.

17:06
MS-Excel---Series And Fill Series

53 views

7 days ago

Claire Loves Math
Mean from a Frequency Table - Fast Food (Fat)
7:18
Mean from a Frequency Table - Fast Food (Fat)

0 views

4 days ago

Prinavin Govender
video1338647510
5:25
video1338647510

0 views

2 days ago

Claire Loves Math
Frequency Table - Global Health (Life Expectancy)
7:14
Frequency Table - Global Health (Life Expectancy)

0 views

4 days ago

Gary Parker
MTH098 Lesson 3.4 Spreadsheet Chart

MTH098 Quantitative Literacy 2 Use Google Sheets to make a comparative line chart for two simple data sets.

5:24
MTH098 Lesson 3.4 Spreadsheet Chart

6 views

4 days ago

Nicholas Perdue
GSP316 Lab1 Final Layout Considerations
7:14
GSP316 Lab1 Final Layout Considerations

0 views

5 days ago