Upload date
All time
Last hour
Today
This week
This month
This year
Type
All
Video
Channel
Playlist
Movie
Duration
Short (< 4 minutes)
Medium (4-20 minutes)
Long (> 20 minutes)
Sort by
Relevance
Rating
View count
Features
HD
Subtitles/CC
Creative Commons
3D
Live
4K
360°
VR180
HDR
2,508,967 results
View full lesson: http://ed.ted.com/lessons/david-mccandless-the-beauty-of-data-visualization David McCandless turns complex ...
1,591,508 views
13 years ago
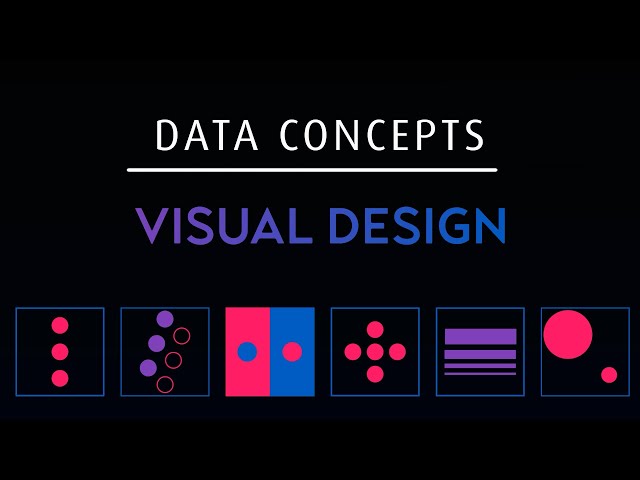
Let's look at how we can implement design concepts and techniques to maximize the impact of our dashboards and reports.
91,989 views
5 years ago
You've probably heard the term data visualization thrown around a lot. It's why you're here, isn't it? So let's make it clear — data ...
192,136 views
4 years ago
MENTORSHIP – Applications for the next cohort are open! Apply here → https://theanalyticsaccelerator.com/ We're looking for ...
67,227 views
1 year ago
Setup, conflict, resolution. You know right away when you see an effective chart or graphic. It hits you with an immediate sense of ...
669,529 views
6 years ago
Viewers like you help make PBS (Thank you ) . Support your local PBS Member Station here: http://to.pbs.org/Donateoffbook ...
517,064 views
In the second episode of ReForm, we look at how big data and art have converged into a new visual culture. Six major data artists ...
76,781 views
11 years ago
Anthropic just dropped a massive update - Claude can now build interactive charts, diagrams and data visualizations directly ...
296 views
4 months ago
Data visualization is present in every aspect of our lives - but is it really as unbiased as it's said to be? In this SciToons video, learn ...
147,520 views
7 years ago
Following a look at 'Sensemaking' Associate Professor Dr Kai Xu delves into some more tricks of the visualisation trade.
75,814 views
3 years ago
LEARN BUSINESS INTELLIGENCE ============================= BI Analyst Starter Program – https://geni.us/lbia_biasp ...
392,923 views
In this video Rob, a Kaggle Grandmaster, quickly and humorously walks through each of the popular plotting and data ...
113,312 views
Nano Banana + Gemini 3: The Data Visualization Workflow You Need | Stop Making Boring Charts – Use This Nano Banana + ...
27,307 views
7 months ago
In this video we take a look at the best resources to learn Data Visualization in 2025! 25% off Analyst Builder Code: ...
17,027 views
Dustin hopes that the audience learns how anyone can use data visualization to improve their work, understand their world, and ...
75,420 views
How to Make Money from Data Visualization? | Zeeshan Usmani ...
65,235 views
Let's look at the art of visualizing data. How do you make eye catching visuals while keeping them easy to consume and ...
15,175 views
Ready to become a certified Cognos Analytics v12 Analyst? Register now and use code IBMTechYT20 for 20% off of your exam ...
13,260 views
Receive top data science/ AI insights in your inbox https://thu-vu.ck.page/49c5ee08f6 Data visualization catalogue ...
43,910 views
Visually explained breakdown of Python vs Power BI for data visualization, showing when to use code and when to use tools.
21,200 views