Upload date
All time
Last hour
Today
This week
This month
This year
Type
All
Video
Channel
Playlist
Movie
Duration
Short (< 4 minutes)
Medium (4-20 minutes)
Long (> 20 minutes)
Sort by
Relevance
Rating
View count
Features
HD
Subtitles/CC
Creative Commons
3D
Live
4K
360°
VR180
HDR
51,615 results
Visit http://ilectureonline.com for more math and science lectures! Before analyzing the Bode function for each of the 7 factors for a ...
179,833 views
6 years ago
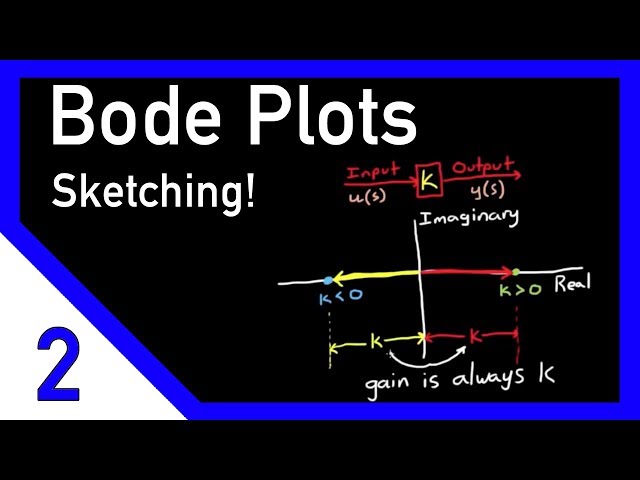
Get the map of control theory: https://www.redbubble.com/shop/ap/55089837 Download eBook on the fundamentals of control ...
1,358,495 views
13 years ago
Andrew Finelli, of UConn HKN, creates the Bode Plots for a given transfer function.
198,366 views
10 years ago
Going through how to draw the approximate bode plot for a system with one zero and two poles.
130,397 views
11 years ago
Bode plot control system Support My Work: If you'd like to support me, you can send your contribution via UPI: ...
1,137,686 views
4 years ago
Bode plots are an essential but sometimes confusing tool for frequency domain analysis. In this video, we'll start with an intuitive ...
91,443 views
2 years ago
Explore three popular methods to visualize the frequency response of a linear time-invariant (LTI) system: the Nichols chart, the ...
127,318 views
5 years ago
Andrew Finelli of UConn HKN introduces an important Signals and Systems topic: creating a Bode Plot given a transfer function.
13,659 views
This presentation provides a basic introduction to Bode plots and explains how Bode plots can be used with an oscilloscope to ...
47,789 views
Learn how frequency domain analysis helps you understand the behavior of physical systems in this MATLAB® Tech Talk by ...
105,284 views
12 years ago
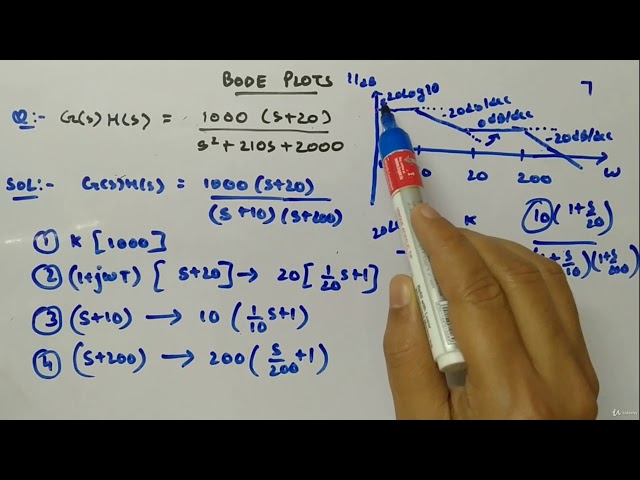
Drawing of Bode Plot is explained with an Example Transfer Function to understand the Frequency Response of Control Systems.
344 views
Tutorial video for ECE 220 class at Mason.
402,631 views
Bode Plot Solved Example is covered by the following Timestamps: 0:00 - Bode Plot Solved Example 0:36 - Procedure to Draw ...
86,096 views
1 year ago
Full Playlist: https://bit.ly/3irbRok.
87 views
KSRMCE #ksrmlecturevideos #controlsystemsbodeplot A Bode Plot is used in control systems to analyze the frequency response ...
154 views
11 months ago
609,615 views
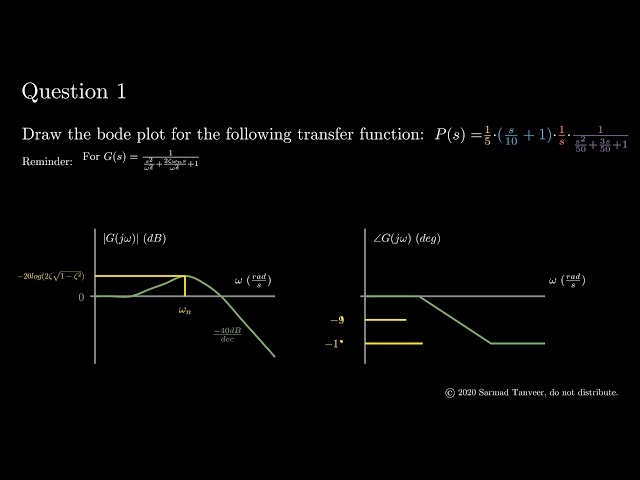
So our first question asks us to draw the bode plot for the following transfer function s plus 10 over s times s squared plus 3 s plus ...
16,621 views
Drawing the Bode Plot of the Frequency response for G(s) = s.
113,594 views
Gain Margin and Phase Margin are explained through Bode Plots while understanding the frequency response of the Control ...
298 views
An Example illustrating the use of smaller transfer functions to create the bode plot of a larger complex transfer function. In this ...
10,467 views
7 years ago