Upload date
All time
Last hour
Today
This week
This month
This year
Type
All
Video
Channel
Playlist
Movie
Duration
Short (< 4 minutes)
Medium (4-20 minutes)
Long (> 20 minutes)
Sort by
Relevance
Rating
View count
Features
HD
Subtitles/CC
Creative Commons
3D
Live
4K
360°
VR180
HDR
2,845 results
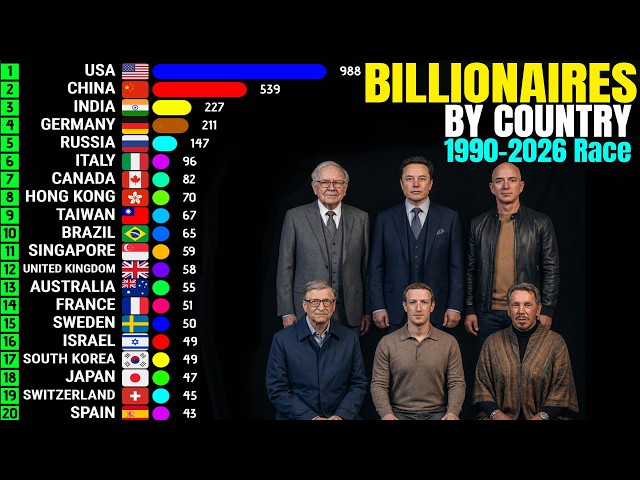
If you enjoy statistics, economics, wealth rankings, history, and animated data visualizations, please like the video, subscribe to ...
46,894 views
2 days ago
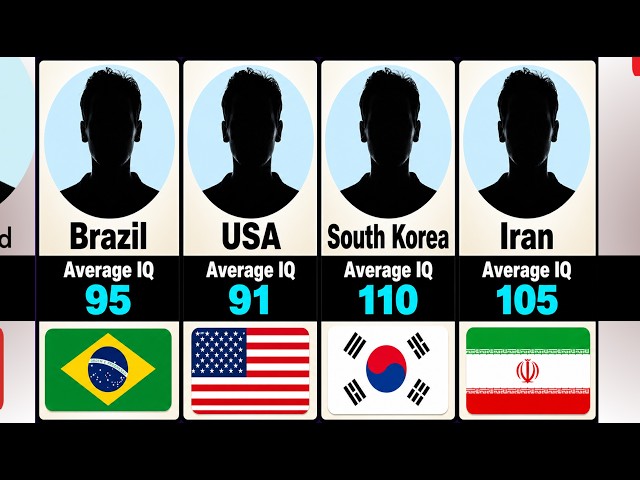
If you enjoy statistics, geography, country rankings, and data visualizations, please Like, Subscribe, and turn on notifications for ...
6,417 views
1 day ago