Upload date
All time
Last hour
Today
This week
This month
This year
Type
All
Video
Channel
Playlist
Movie
Duration
Short (< 4 minutes)
Medium (4-20 minutes)
Long (> 20 minutes)
Sort by
Relevance
Rating
View count
Features
HD
Subtitles/CC
Creative Commons
3D
Live
4K
360°
VR180
HDR
72 results
Using the plot command interactively ipython -pylab pylab brings in the libraries necessary for Scientific Computing. linspace, len ...
1,743 views
11 years ago
Join this channel to get access to perks: https://www.youtube.com/channel/UC4C_tfy6WLDxzVVO3y6YinA/join This is my ...
27 views
1 year ago
Saving plots basic savefig png, pdf, ps, eps, svg going to OS and looking at the file.
1,125 views
प्लॉट्स के अन्य प्रकार scatter pie chart bar chart log illustration of other plots, matplotlib help.
330 views
50 views
पाइथन मॉड्यूल्स उपयोग करना scipy pylab sys.
1,916 views
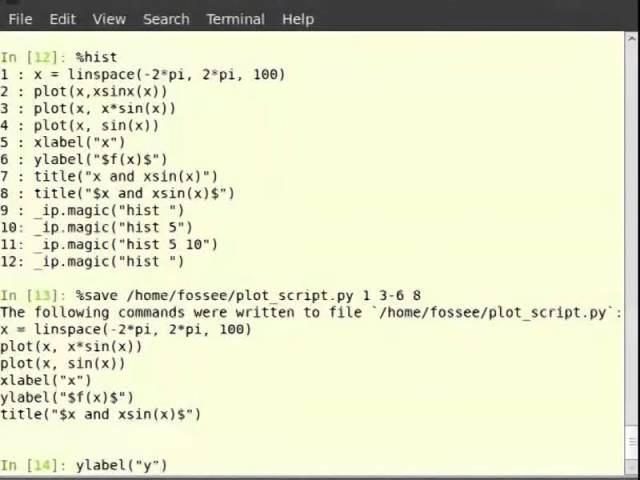
आईपाइथन की अतिरिक्त विशेषताएँ ave, %history, %run.
534 views
5,423 views
Embellishing a plot Title Label line width, color, style annotations.
6,951 views
Getting started with strings strings single, double, triple quoted accessing elements show immutability tell that there are methods ...
338 views
डेटा प्लॉट करना, स्क्वायर फंक्शन का उपयोग करके L vs. T2 प्लॉट करना, 3cols के ...
371 views
4,522 views
Other types of plots scatter pie chart bar chart log illustration of other plots, matplotlib help.
2,323 views
861 views
Additional features of IPython ave, %history, %run.
3,098 views
Plotting the data plot L vs. T2 using square function problem with 3 cols 3rd column is error error bar.
2,325 views
Have you ever wondered how to group or categorise your SNOMED codes? You can use the Pathling Python library to call out to ...
612 views
2 years ago
6,093 views
7 years ago
In this short video tutorial, 4TU.ResearchData's Senior Developer of Open Science Infrastructures, Kees den Heijer, explains the ...
361 views
3 years ago
108 views