ViewTube

ViewTube
Sign inSign upSubscriptions
Filters

Upload date

Type

Duration

Sort by

Features

Reset

41 results

COMPUTER & EXCEL SOLUTION
function in python in hindi with full explanation@COMPUTEREXCELSOLUTION #python #function

Join this channel to get access to perks: https://www.youtube.com/channel/UC4C_tfy6WLDxzVVO3y6YinA/join This is my ...

9:14
function in python in hindi with full explanation@COMPUTEREXCELSOLUTION #python #function

27 views

1 year ago

MOOC de l'IMT
8. Queuing Structures for Graph Traversals 🌐 Advanced Algorithmics and Graph Theory with Python

Strengthen your skills in algorithmics and graph theory, and gain experience in programming in Python along the way. To follow ...

11:09
8. Queuing Structures for Graph Traversals 🌐 Advanced Algorithmics and Graph Theory with Python

3,284 views

7 years ago

Pathling
How to group SNOMED data using Python and a terminology server

Have you ever wondered how to group or categorise your SNOMED codes? You can use the Pathling Python library to call out to ...

9:39
How to group SNOMED data using Python and a terminology server

618 views

2 years ago

Inria Learning Lab
Comparing train and test errors

This video is part of the Mooc “Machine learning in Python with scikit-learn ” hosted on FUN platform: ...

12:26
Comparing train and test errors

3,207 views

3 years ago

Marco Winzker (Professor)
Pattern Recognition with NN on FPGA - Suggestions for Experiments

Video 5. Lecture Series on Neural Network for Pattern Recognition on an FPGA Lecture 5 of a project to implement a neural ...

5:23
Pattern Recognition with NN on FPGA - Suggestions for Experiments

1,161 views

3 years ago

NPTEL IIT Bombay
Tutorial 05 Part 02: Speckle Filtering Using Python Using Gaussian Filter

Week 6: Tutorial 05 Part 02: Speckle Filtering Using Python Using Gaussian Filter.

19:17
Tutorial 05 Part 02: Speckle Filtering Using Python Using Gaussian Filter

768 views

3 years ago

Pixelpi Indonesia
How to install both Python 3 and Python 2 on Windows in 5.minute

This is my 1st tutorial video, http://www.python.org dont forget to like, comment and subscribe also follow me on instagram ...

4:08
How to install both Python 3 and Python 2 on Windows in 5.minute

157 views

7 years ago

J David Eisenberg
Chapter 10: Nested Lists

Working with lists inside lists.

6:50
Chapter 10: Nested Lists

1,035 views

7 years ago

UBC_CPSC_103 _screencasts
Module 7: How to Design Analysis Programs: Part 1
6:26
Module 7: How to Design Analysis Programs: Part 1

6,094 views

7 years ago

4TU. ResearchData
How To #5: Work With NetCDF and OPeNDAP protocol

In this short video tutorial, 4TU.ResearchData's Senior Developer of Open Science Infrastructures, Kees den Heijer, explains the ...

6:05
How To #5: Work With NetCDF and OPeNDAP protocol

361 views

3 years ago

Dutton Institute
MLR Data Set Up Visualization

Video for EME 210 at Penn State. All sectors of the energy industry and related fields continuously use data to inform decisions.

6:51
MLR Data Set Up Visualization

104 views

2 years ago

COMPUTER & EXCEL SOLUTION
Python Class 12 | Creating Reading Searching CSV File | File Handling  @COMPUTEREXCELSOLUTION

excel #python #viral Join this channel to get access to perks: ...

5:06
Python Class 12 | Creating Reading Searching CSV File | File Handling @COMPUTEREXCELSOLUTION

385 views

2 years ago

NoobScience
Atomic Weight Calculator CLI - Tutorial in Python

Atomic Weight Calculator CLI - Tutorial in Python A Simple CLI Atomic Weight Calculator written in python, beginner friendly and ...

9:44
Atomic Weight Calculator CLI - Tutorial in Python

71 views

4 years ago

MOOC de l'IMT
11. Algorithm Complexity 🌐 Advanced Algorithmics and Graph Theory with Python

Strengthen your skills in algorithmics and graph theory, and gain experience in programming in Python along the way. To follow ...

6:00
11. Algorithm Complexity 🌐 Advanced Algorithmics and Graph Theory with Python

2,984 views

7 years ago

K Dunn
Data Visualization - 04 - Scatter plots

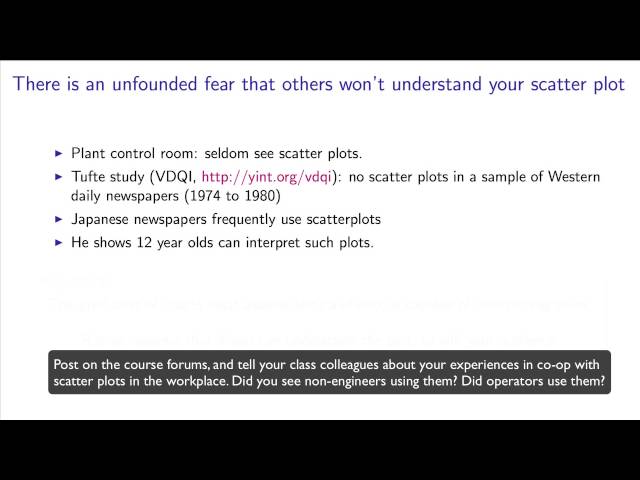
These videos are part of the FREE online book, "Process Improvement using Data", http://yint.org/pid Related is the Coursera ...

7:24
Data Visualization - 04 - Scatter plots

3,685 views

11 years ago

MOOC de l'IMT
13. Bruteforce to solve NP-Complete Problems 🌐 Advanced Algorithmics and Graph Theory with Python

Strengthen your skills in algorithmics and graph theory, and gain experience in programming in Python along the way. To follow ...

8:56
13. Bruteforce to solve NP-Complete Problems 🌐 Advanced Algorithmics and Graph Theory with Python

3,468 views

7 years ago

NPTEL IIT Bombay
Lecture 26: Logistic Regression

Lecture 26: Logistic Regression.

10:02
Lecture 26: Logistic Regression

4,888 views

6 years ago

DHIS2
3.1.1 Orientation to charts [Part 1 of 1]

Charts are the second visualization tool within the Data Visualizer app in DHIS2 that we'll cover in this course. In this video, you ...

7:49
3.1.1 Orientation to charts [Part 1 of 1]

4,805 views

3 years ago

Spoken-Tutorial IIT Bombay
Plotting 2D graphs - Tamil
10:35
Plotting 2D graphs - Tamil

392 views

11 years ago

datalabcc
The Data Science Venn Diagram - Data Science: An Introduction - 2.2

Data science sits at the intersection of coding, math/statistics, and applied domain knowledge. This video explores those ...

6:59
The Data Science Venn Diagram - Data Science: An Introduction - 2.2

9,457 views

9 years ago