Upload date
All time
Last hour
Today
This week
This month
This year
Type
All
Video
Channel
Playlist
Movie
Duration
Short (< 4 minutes)
Medium (4-20 minutes)
Long (> 20 minutes)
Sort by
Relevance
Rating
View count
Features
HD
Subtitles/CC
Creative Commons
3D
Live
4K
360°
VR180
HDR
174,133 results
Check out our weekly system design newsletter: https://bit.ly/3tfAlYD Checkout our bestselling System Design Interview books: ...
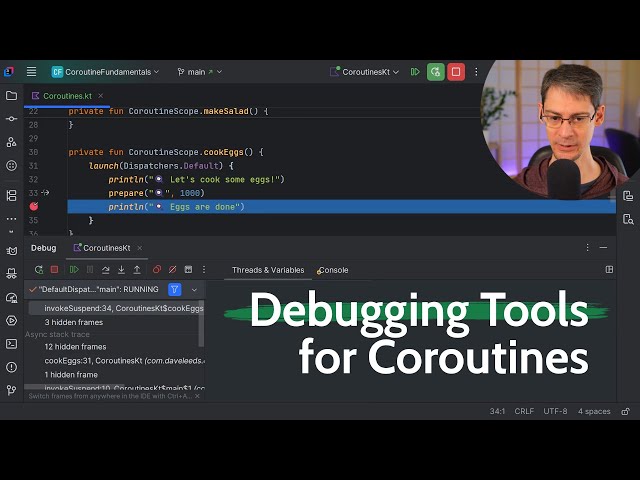
152,324 views
2 years ago
Coroutines bring new challenges when it comes to debugging - regular stack traces aren't much help when the async work was ...
3,190 views
7 months ago
Review code better and faster with my 3-Factor Framework: https://arjan.codes/diagnosis. This video is a quick guide to ...
86,776 views
1 year ago
If you're still using console.log() to find and fix JavaScript issues, you might be spending more time debugging than you need to.
901,576 views
8 years ago
Let's see how the IntelliJ IDEA debugger can help us find and fix bugs… and learn some neat tricks about the debugger in the ...
19,497 views
10 months ago
Performance debugging just got a whole lot easier. Learn how our new Chrome DevTools Performance panel is more accessible ...
18,077 views
8 months ago
To watch this keynote interpreted in American Sign Language (ASL), please click here → https://goo.gle/3LYclAp Learn how new ...
30,399 views
3 years ago
In this video, we'll talk about how to debug your Java code using IntelliJ's builtin debugger. Being able to navigate a debugger ...
35,897 views
You already know what my debugging technique is. The trick is to remember to do it in the frustration of the moment. ❤️ Have ...
1,795 views
We all spend a lot of time in the debugger, so this session teaches you about some of the powerful debugging features available ...
60,739 views
6 years ago
What do you do when you're learning HTML, but you get stuck on a problem? Today's video is all about debugging: the step by ...
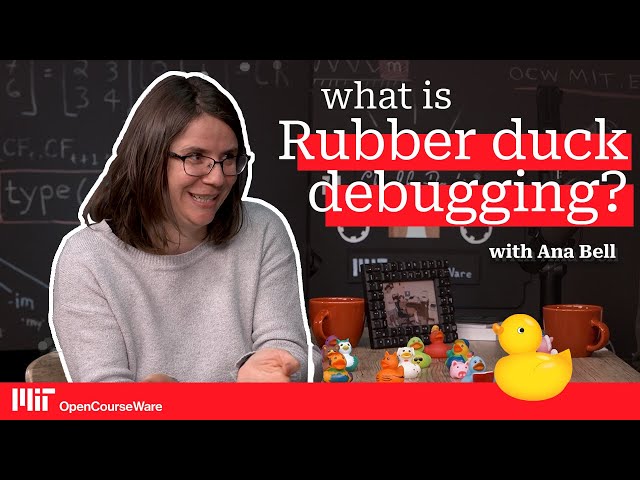
1,699 views
4 years ago
Ana Bell explains “rubber duck debugging," a technique in which a programmer explains their code to an inanimate object in ...
18,407 views
How to debug JavaScript Code in VsCode and Chrome. Learn VsCode Debugger and Chrome Debugger. Debugging with a ...
72,197 views
George Hotz, comma.ai Forget reversible debugging, why is it that the concept of time exists in debugging at all? Viewing ...
249,301 views
9 years ago
Mentorship/On-the-Job Support/Consulting - https://calendly.com/antonputra/youtube or me@antonputra.com Benchmarks: ...
17,635 views
This video is about how to debug Python code with standard Python Debugger or just PDB or Python PDB. How to use PDB ...
6,397 views
This is CS50 Explained, wherein David J. Malan and Doug Lloyd watch CS50's lectures and discuss the pedagogy behind CS50 ...
3,525 views
This video is part of an online course, Software Debugging. Check out the course here: https://www.udacity.com/course/cs259.
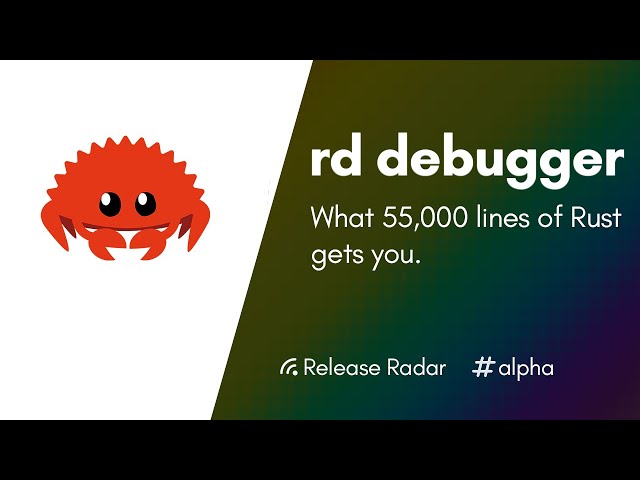
38,618 views
10 years ago
The Record & Debug Tool (rd) is a Rust language port of the rr-debugger/rr debugger. With rd you can record Linux program ...
5,021 views
Google Cloud offers many tools that can help you manage your application services. In this video, we teach you how to set up and ...
29,315 views
5 years ago