Upload date
All time
Last hour
Today
This week
This month
This year
Type
All
Video
Channel
Playlist
Movie
Duration
Short (< 4 minutes)
Medium (4-20 minutes)
Long (> 20 minutes)
Sort by
Relevance
Rating
View count
Features
HD
Subtitles/CC
Creative Commons
3D
Live
4K
360°
VR180
HDR
342 results
How to make animated plot (animated chart) with Matplotlib and Python programming Language. In this tutorial, an animated plot ...
24,712 views
3 years ago
Source code: https://gist.github.com/syphh/9fa861563977e2cbbf4ddea518677b0a Learn graph theory algorithms: ...
1,217 views
In this video Rob, a Kaggle Grandmaster, quickly and humorously walks through each of the popular plotting and data ...
107,724 views
In the ever-evolving world of data visualization, scatterplot animation has emerged as a captivating and powerful tool to breathe ...
172 views
2 years ago
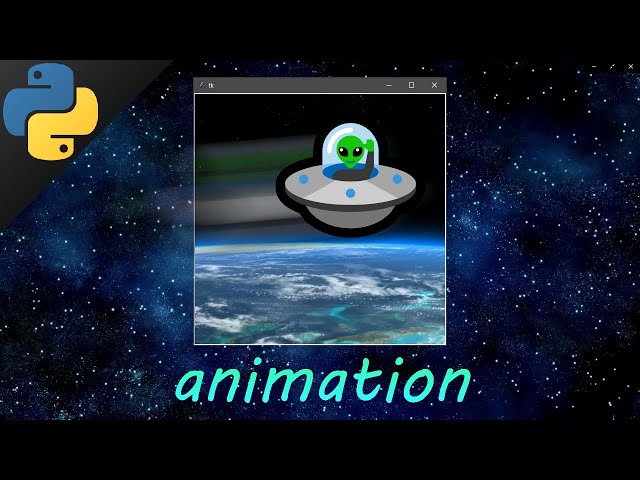
Python tkinter animation animations canvas tkinter GUI tutorial #Python #tkinter #animation #animations #canvas #GUI #tutorial.
57,888 views
5 years ago
Visualization is central to the process of how we think. This video reviews the inner workings of Python's most popular plotting ...
3,756 views
Python tkinter animation animate multiple objects tutorial for beginners #Python #tkinter #animation #animate #multiple #objects ...
42,653 views
In this video, we are going to learn about how to create a responsive bar chart animations in 3 lines of code using our favourite ...
726 views
4 years ago
Textbooks: https://amzn.to/2VmpDwK https://amzn.to/2GQSV3D https://amzn.to/2SvTOQx Welcome to Engineering Python. This is ...
1,307 views
7 years ago
Welcome to a Matplotlib with Python 3+ tutorial series. In this series, we're going to be covering most aspects to the Matplotlib data ...
699,717 views
10 years ago
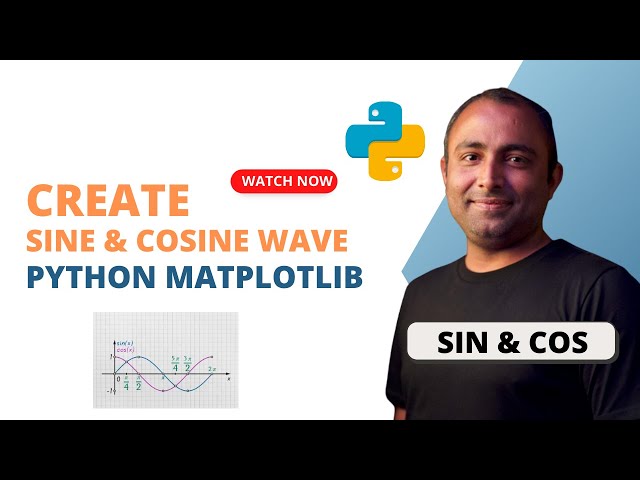
In this video, we will visualize the sine and cosine waves using Python's Matplotlib library. The video showcases a dynamic ...
792 views
Review code better and faster with my 3-Factor Framework: https://arjan.codes/diagnosis. In this video, I'll share 15 Python ...
452,436 views
Let's make an animation with a rectangle using Python PyGame. ALL PLAYLIST ...
346 views
Matplotlib is used to customize visuals and create animation and Seaborn is used to create exploratory charts like Heat map ...
855 views
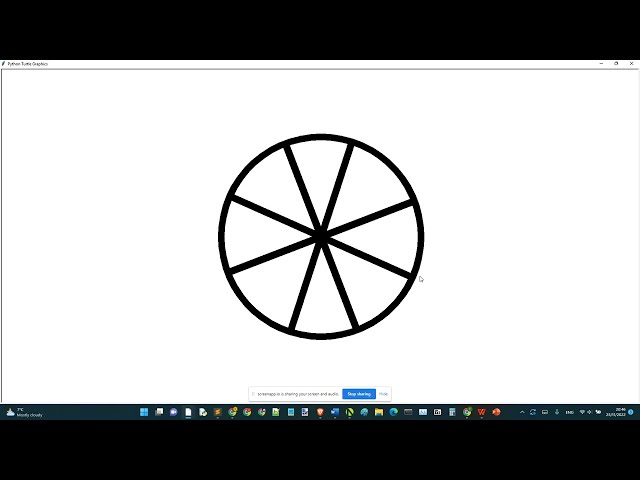
Warning: If the speed is a multiple of 180, the wheel will not spin at all. If you make the speed larger than 10, there is a risk of the ...
3,208 views
Organized by textbook: https://learncheme.com/ 21st screencast of a series on Python. Made by faculty at the New Jersey Institute ...
1,060 views
Matplotlib is a plotting library for Python. It is used along with NumPy to provide an environment that is an effective open source ...
264 views
I'll go to my animations tab at the top of the screen and the wipe animation is what's going to allow it to look like it grows as it ...
1,057 views
6 years ago
Ticks are the markers denoting data points on the axes and tick labels are the name given to ticks. By default Matplotlib, itself ...
584 views
python code for Mutliple bar charts link: https://drive.google.com/file/d/1EMG1YjT6pZgTv1yYTjRP1EnCUi1CJK72/view?usp=sharing ...
1,056 views