ViewTube

ViewTube
Sign inSign upSubscriptions
Filters

Upload date

Type

Duration

Sort by

Features

Reset

106,223 results

Kimberly Fessel
Introduction to Seaborn | How seaborn Python works with matplotlib along with seaborn and pandas

This first video of my "Introduction to Seaborn" series covers the basics of seaborn, a Python library for data visualization. Here ...

7:27
Introduction to Seaborn | How seaborn Python works with matplotlib along with seaborn and pandas

79,399 views

5 years ago

Datademia
Data Visualization with Python - MatplotLib vs. Seaborn

If you work with data in Python, at some point you'll need to visualize it. In this video, I'll show you the differences ...

7:04
Data Visualization with Python - MatplotLib vs. Seaborn

1,597 views

8 months ago

Machine Learnia
SEABORN PYTHON TUTORIAL PAIRPLOT etc: The MOST BEAUTIFUL GRAPHICS in 1 Line of Code! (19/30)

This French Python tutorial introduces you to Seaborn, the best library for data visualization. Seaborn allows you to create ...

17:47
SEABORN PYTHON TUTORIAL PAIRPLOT etc: The MOST BEAUTIFUL GRAPHICS in 1 Line of Code! (19/30)

122,219 views

6 years ago

Rob Mulla
7 Python Data Visualization Libraries in 15 minutes

In this video Rob, a Kaggle Grandmaster, quickly and humorously walks through each of the popular plotting and data ...

15:03
7 Python Data Visualization Libraries in 15 minutes

108,313 views

4 years ago

AnalytiCode
Seaborn Objects Tutorial: Powerful but Frustrating? (Python Data Visualization Deep Dive)

In my last video, I showed how elegant and simple plotnine makes the Grammar of Graphics in Python. This time, I put Seaborn's ...

16:26
Seaborn Objects Tutorial: Powerful but Frustrating? (Python Data Visualization Deep Dive)

350 views

3 months ago

Andy McDonald
Creating Multiple Subplots the Easy Way  - Seaborn FacetGrid Introduction

The Seaborn FacetGrid is a great way to make multiple subplots within Python. It allows you to map any of the standard Seaborn ...

13:35
Creating Multiple Subplots the Easy Way - Seaborn FacetGrid Introduction

6,554 views

3 years ago

Pivotalstats
Comprehensive Guide on MATPLOTLIB, SEABORN & PLOTLY | Python Data Analysis

Data Used: https://www.nasdaq.com/market-activity/stocks/aapl/historical Google Colab Link: https://colab.research.google.com/ ...

14:30
Comprehensive Guide on MATPLOTLIB, SEABORN & PLOTLY | Python Data Analysis

9,034 views

2 years ago

Kimberly Fessel
What is kernel density estimation? And how to build a KDE plot in Python? | Seaborn KDEplot

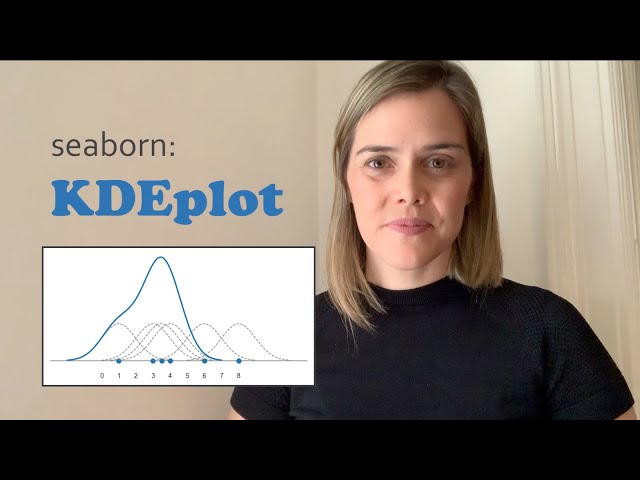
This seaborn kdeplot video explains both what the kernel density estimation (KDE) is as well as how to make a kde plot within ...

9:13
What is kernel density estimation? And how to build a KDE plot in Python? | Seaborn KDEplot

119,430 views

5 years ago

Absent Data
How to Visualize Data in Python Using Seaborn | Seaborn Tutorial.

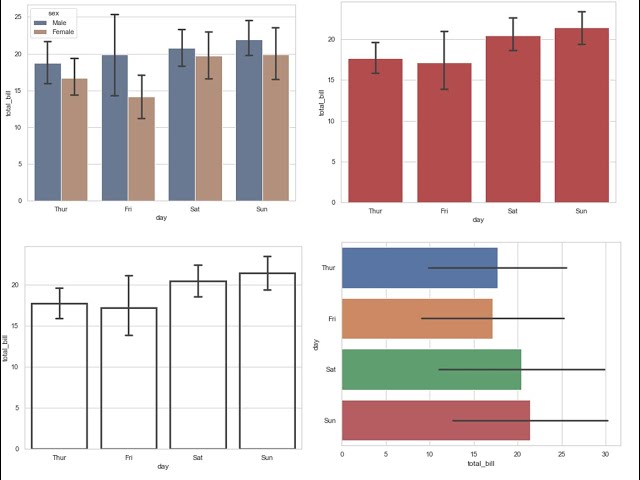
Learn how you can quickly make statistical visuals in Seaborn, Python's best library for data visualization. Find the notebook here: ...

15:46
How to Visualize Data in Python Using Seaborn | Seaborn Tutorial.

17,204 views

3 years ago

Andy McDonald
Seaborn Pairplot - How to Create a Pairplot for Data Visualization in Python Using Seaborn

The Seaborn pairplot allows us to easily take a dataframe and generate a single figure showing the relationships between all of ...

10:36
Seaborn Pairplot - How to Create a Pairplot for Data Visualization in Python Using Seaborn

9,086 views

3 years ago

Data Science Tutorials
How to create Point Plot using Python Seaborn Library

In this python seaborn tutorial I have shown you how you can create point plot which is one of the nicest way to visualize data and ...

5:24
How to create Point Plot using Python Seaborn Library

490 views

5 years ago

Kimberly Fessel
Seaborn clustermap | How the clustermap works and what is the clustermap?

This seaborn clustermap tutorial video shows you how to create a clustermap using Python seaborn. First we talk about what the ...

12:56
Seaborn clustermap | How the clustermap works and what is the clustermap?

17,522 views

4 years ago

Kimberly Fessel
What is a violin plot and how to make a Seaborn violinplot in Python

This seaborn violinplot video covers the basics of how to interpret and build a violin plot in Python seaborn. I begin by sharing a ...

11:04
What is a violin plot and how to make a Seaborn violinplot in Python

25,365 views

5 years ago

RegenerativeToday
Barplot in Details Using Python's Seaborn Library

This video is a tutorial on relplot that uses both scatterplot and lineplot. Here is the GitHub link to the code of this tutorial: ...

9:36
Barplot in Details Using Python's Seaborn Library

512 views

3 years ago

Acadaimy
Seaborn Regression Plots | Seaborn Python Machine Learning

In this video, you'll learn about creating regression plots using Seaborn. Seaborn is essential to Machine Learning! It allows you to ...

5:50
Seaborn Regression Plots | Seaborn Python Machine Learning

1,377 views

4 years ago

Kimberly Fessel
Seaborn relplot | Tutorial on building relational plots with Python Seaborn relplot

This Seaborn relplot tutorial video shows you how to visualize variable relationships with the relplot. I first walk you through the ...

13:03
Seaborn relplot | Tutorial on building relational plots with Python Seaborn relplot

10,296 views

4 years ago

Kimberly Fessel
Seaborn swarmplot | What is a swarm plot and how do you make a swarmplot with Python seaborn?

The seaborn swarmplot is described in detail in this Python seaborn tutorial. First, I explain what a swarm plot is, how you can ...

11:21
Seaborn swarmplot | What is a swarm plot and how do you make a swarmplot with Python seaborn?

10,437 views

5 years ago

Moyete
Curso Seaborn Python tutorial graficas y visualización de datos

En este video aprenderás a realizar gráficas con Python directamente de dataframes de Pandas, utilizando la librería Seaborn, ...

18:42
Curso Seaborn Python tutorial graficas y visualización de datos

9,965 views

4 years ago

Kimberly Fessel
Seaborn heatmap | How to make a heatmap in Python Seaborn and adjust the heatmap style

The Seaborn heatmap is a simple visual that allows you to display tables of data through color. This Seaborn heatmap tutorial ...

13:03
Seaborn heatmap | How to make a heatmap in Python Seaborn and adjust the heatmap style

72,554 views

5 years ago

Analytical Mindset
Practice Questions on Python Seaborn Visualization | Beginner to Expert in Python Seaborn

Practice Questions on Python Seaborn Visualization | Beginner to Expert in Python Seaborn 00:00 Ques 1 : Plot Histogram & Box ...

18:06
Practice Questions on Python Seaborn Visualization | Beginner to Expert in Python Seaborn

429 views

2 years ago