Upload date
All time
Last hour
Today
This week
This month
This year
Type
All
Video
Channel
Playlist
Movie
Duration
Short (< 4 minutes)
Medium (4-20 minutes)
Long (> 20 minutes)
Sort by
Relevance
Rating
View count
Features
HD
Subtitles/CC
Creative Commons
3D
Live
4K
360°
VR180
HDR
1,303 results
In this video, learn how to install matplotlib on Windows. We will also install Python 3 and pip. PIP is used to install and manage ...
2,321 views
2 months ago
Master Data Analysis with Python and Get Job-Ready: https://techvidvan.com/courses/python-data-analysis-course-hindi/?campaign ...
1,659 views
2 years ago
1,409 views
In this Python Matplotlib Tutorial, I will show step-by-step how to adjust the height of subplots using Matplotlib. Here I also explain, ...
652 views
3 years ago
Tutorial on how to plot bar chart with error bars in matplotlib python programming language. Also intuition of Error Bars in ...
5,658 views
5 years ago
1,389 views
Learn to plot graphs in Python in this tutorial! We cover matplotlib and show you how to get an awesome looking plot. As part of ...
56,099 views
Sebastian's books: https://sebastianraschka.com/books/ In this video, I am showing you how to use my favorite plotting library to ...
3,633 views
Master Data Analysis with Python and Get Job-Ready: ...
3,704 views
Video Topic: Python for Data Science Roadmap 2025 || How to Learn Data Science with Python 🐍 Python for Data Science Roadmap ...
259 views
3 months ago
Visualization is central to the process of how we think. This video reviews the inner workings of Python's most popular plotting ...
3,800 views
How to use Python in Excel natively using libraries like Pandas, NumPy, Matplotlib, Seaborn and more. In this video I'll show you ...
245,588 views
In this lesson, learn how to plot a line with DataFrame in Matplotlib. We will use both the Matplotlib and Pandas library.
7,408 views
पायथन (विंडोज़) के नवीनतम संस्करणों में MatPlotLib को इंस्टॉल करना सीखें ...
117,855 views
Data analysis using Python; https://ibm.biz/Using_Python Beginner's guide to python; https://ibm.biz/Python_for_beginners If ...
265,225 views
Three-dimensional (3D) Line Chart Plotting in Python using Matplotlib (mplot3d tutorial). ➖ In this Video, we wall talk about how to ...
2,335 views
In this lesson, learn how to add labels to a plot in Matplotlib. We can add labels to a plot easily in Matplotlib using two methods i.e. ...
3,614 views
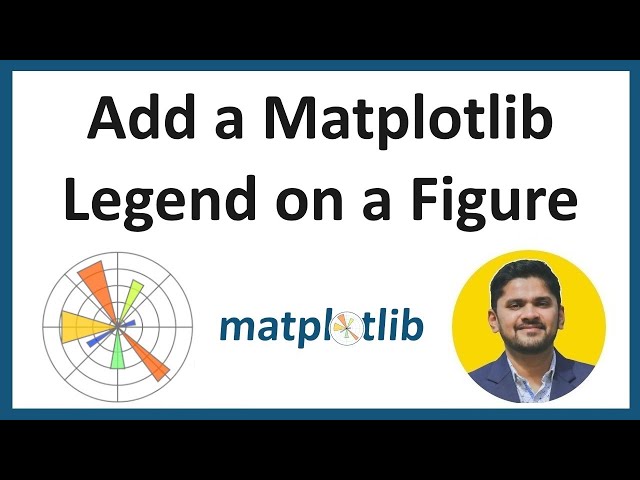
In this lesson, learn how to add a Matplotlib Legend in a Graph. A legend in a graph is a box on the left and right displaying the ...
3,571 views
1,216 views
In this lesson, learn to position legend in Matplotlib. We can easily position legends in Matplotlib using the loc parameter of the ...
2,565 views
In this lesson, learn to plot titles and position them in Matplotlib. To set the titles in a graph, use the title() function in Matplotlib.
3,325 views
Intro to Data Analysis Visualization with Python, Matplotlib and Pandas: Introduction and Overview: Time series and forecasting ...
6,340 views
By default when you plot Matplotlib Scatter Plot, it will be plotted with the default marker color, marker style, and size. But if you ...
498 views
Tutorial on setting graph labels and titles in different languages using Matplotlib and plotly. The notebook can be found in the ...
508 views
In this video in hindi you learn How to choose right chart for visualization for a specific solution. Python Playlist-English ...
216 views
1 year ago
![How to Install Matplotlib with latest Python 3.14 on Windows 10/11 [2025 Update] Matplotlib Tutorial](/api/proxy/image?url=https%3A%2F%2Fi.ytimg.com%2Fvi%2FJqTjyPhRHMw%2Fsddefault.jpg)
![Python Matplotlib Practical - How to Install Matplotlib Library in Python and Design a Chart [Hindi]](/api/proxy/image?url=https%3A%2F%2Fi.ytimg.com%2Fvi%2FfT66wJg54aQ%2Fsddefault.jpg)
![Python Matplotlib Practical - How to Install Matplotlib in Pycharm | Matplolib Installation [Hindi]](/api/proxy/image?url=https%3A%2F%2Fi.ytimg.com%2Fvi%2FBzOo2YHX7T0%2Fsddefault.jpg)


![How to Change Color and Font of Title, x-axis & y-axis of Chart Using Python Matplotlib [Hindi]](/api/proxy/image?url=https%3A%2F%2Fi.ytimg.com%2Fvi%2FMcK7Y1Ln1lg%2Fsddefault.jpg)


![Introduction to Data Analysis with Python for Beginners [Hindi]](/api/proxy/image?url=https%3A%2F%2Fi.ytimg.com%2Fvi%2FFZ8uurIti08%2Fsddefault.jpg)


![Python Matplotlib Practical - How to Change Font of Title and Axis in Chart using Matplotlib [Hindi]](/api/proxy/image?url=https%3A%2F%2Fi.ytimg.com%2Fvi%2FCN8lITmFgkA%2Fsddefault.jpg)


