Upload date
All time
Last hour
Today
This week
This month
This year
Type
All
Video
Channel
Playlist
Movie
Duration
Short (< 4 minutes)
Medium (4-20 minutes)
Long (> 20 minutes)
Sort by
Relevance
Rating
View count
Features
HD
Subtitles/CC
Creative Commons
3D
Live
4K
360°
VR180
HDR
93 results
In this video, we delve into the common yet perplexing issue of 'Invalid Write' errors encountered in Valgrind, a powerful tool for ...
27 views
7 months ago
[C++ 8.6]: Serie completa http://bit.ly/CppGameDev19 Serie anterior C++: http://bit.ly/CppDev2016-19 Librería TinyPTC UA: ...
1,005 views
5 years ago
[C++ 11.A.5]: Serie completa http://bit.ly/CppGameDev19 Librería TinyPTC UA: http://bit.ly/tinyPTC-UA19 Librería PicoPNG UA: ...
980 views
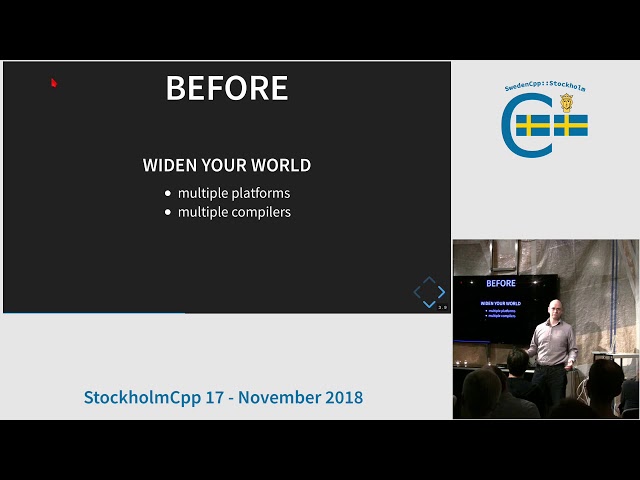
A lightning talk Slides: https://www.pauldreik.se/talks/20181122_debugging_tips/ Recorded at SwedenCpp::Stockholm, ...
328 views
7 years ago
This is part of the Valgrind and Sanitizers Training, November 1, 2024 ...
36 views
1 year ago
C++ embedded TCL interpreter possible memory leaks ✧ I really hope you found a helpful solution! ♡ The Content is licensed ...
5 views
9 months ago
Why is there a memory leak in this program and how can I solve it, given the constraints (using malloc and free for objects ...
8 views
2 years ago
by Sébastien Valat At: FOSDEM 2019 https://video.fosdem.org/2019/H.2215/malt_malloc.webm In HPC the memory available is ...
137 views
6 years ago
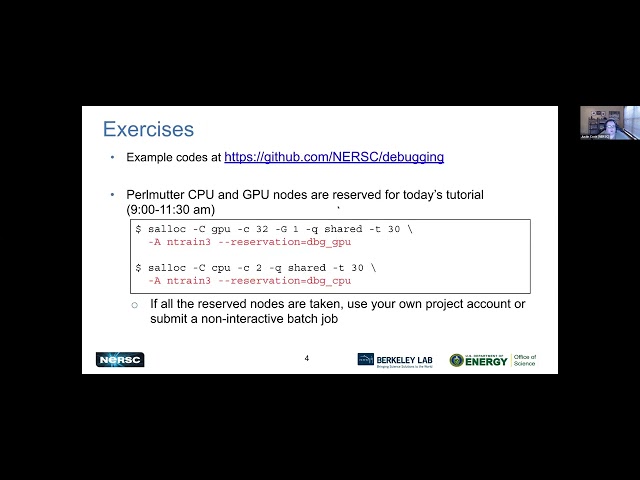
Part of the NERSC New User Training on September 28, 2022. Please see ...
108 views
3 years ago
This is a five-minute flash talk on a proof tool for Linux.
6,855 views
11 years ago
Speakers: Frank Ch. Eigler; Aaron Merey Developers and troubleshooters often need to debug binaries. Often, these binaries are ...
431 views
4 years ago
L'optimització prematura és l'arrel de tot mal, però l'optimització informada és enginyeria de qualitat. En aquest vídeo explorarem ...
1 view
1 month ago
Σε αυτό το βίντεο βλέπουμε πως μπορούμε να χρησιμοποιήσουμε το valgrind memcheck για να εντοπίσουμε memory errors σε ...
42 views
QML Beginners: https://www.udemy.com/course/qml-for-beginners/?referralCode=3B69B9927B587BBF40F1 Qt Core Beginners: ...
66,639 views
Is boost::filesystem thread-safe? I hope you found a solution that worked for you :) The Content is licensed under ...
3 views
Our first talk of Spooky Pyninsula #27, our second virtual Pyninsula, hosted on October 27, 2020. More info at https://pyninsula.org ...
152 views
Tutorial on how to install IAR Plugin for debugging and programming F4-DiscoverFree board using IAR Embedded Workbench.
1,518 views
12 years ago
Beginner Guide to debugging/dissembling applications with GDB(The GNU Debugger) 0:00 Intro 0:31 Chapter 1 (Basic usage) ...
177 views
What is memory safety and why is it important? Why do programmers like me care about it? This video is an attempt to explain ...
3,046 views
This is a short screencast showing the latest features in the QML Profiler UI. The QML Profiler is part of Qt Creator. The version ...
8,974 views
13 years ago


![[Flash Talk] Profiling tool for Linux](/api/proxy/image?url=https%3A%2F%2Fi.ytimg.com%2Fvi%2FY-cnjvgw1KA%2Fsddefault.jpg)


