Upload date
All time
Last hour
Today
This week
This month
This year
Type
All
Video
Channel
Playlist
Movie
Duration
Short (< 4 minutes)
Medium (4-20 minutes)
Long (> 20 minutes)
Sort by
Relevance
Rating
View count
Features
HD
Subtitles/CC
Creative Commons
3D
Live
4K
360°
VR180
HDR
175 results
Replaced by: https://youtu.be/RiAyG8O56ic This is an example on how to calculate a frequency response. The example is a ...
35 views
5 years ago
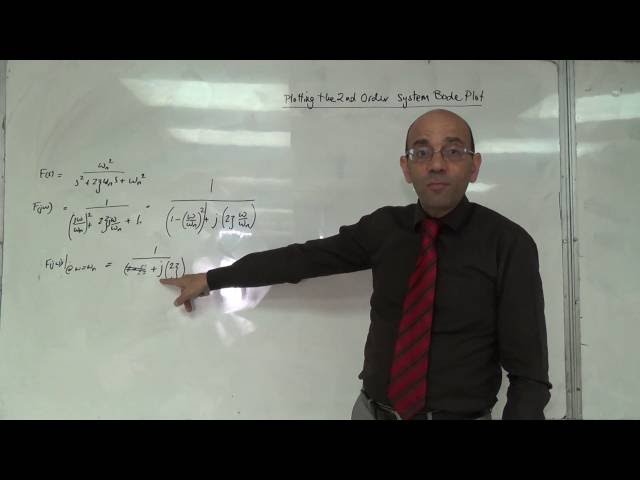
In this video, I have plotted the magnitude plot of a transfer function.
49,847 views
6 years ago
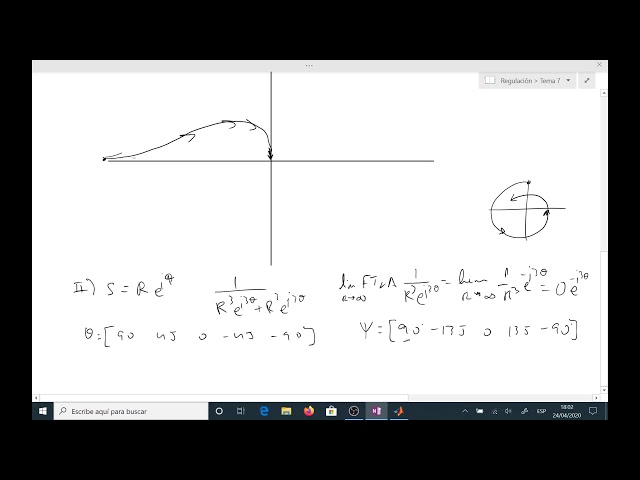
Imágenes de cada uno de esos tramos el primero sería la traza polar. Límite cuando la función transferencia. Junto a mega ...
1,598 views
4 years ago
In this video I have drawn the phase plot for the transfer function which has it's magnitude plot in the video below: ...
51,933 views
7 years ago
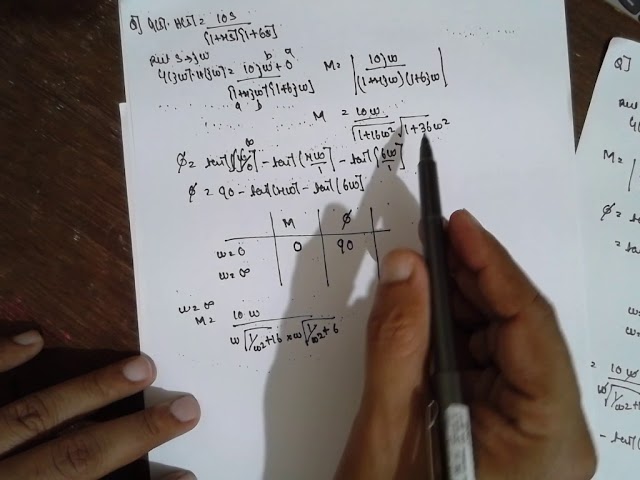
En este caso pues sería 20 logaritmos de cada 0 cuales pues entonces si tenemos un diagrama de bode y nos fijamos las ...
429 views
Replaced by: https://youtu.be/gUHmqyKdwYU Here we are exploring what it menas if we do have dead-time elements in the ...
65 views
3,636 views
10 years ago
8,870 views
9 years ago
This video details about how to determine the intersection point on the real axis of polar plot?. The polar plot is a topic of control ...
4,498 views
Table of Contents: 00:00 - Corners & starting pts 02:36 - Ex 1 Asymptotes 03:53 - Ex 1 Sketch 05:36 - Ex 2 Asymptotes 06:30 - Ex ...
1,067 views
11 years ago
This video explains a very simple and accurate method to draw bode plot. it is divided into four part, this video lecture is the part ...
52,485 views
POLAR PLOT (special problems) CONTROL ENGINEERING LEC-5.
1,036 views
POLAR PLOT (TYPE-2,TYPE-3,ORDER-1,ORDER-2,) CONTROL ENGG, LEC-3.
2,975 views
NOTES LINK:
11,886 views
3,503 views
9,069 views
This video (part of the Frequency Response Methods) shows how to plot the Bode plot for the product of a number of functions.
4,183 views
12 years ago
This video (part of the Frequency Response Methods) solves a practical example on plotting the Bode plot for a system that is ...
7,598 views
... الدرس 3 : Bode- Nequist Diagram • Determine AR and the phase angle • Logarithmic plot • Polar plot • Bode diagram definition.
917 views
This video explains about the basic steps to draw polar plot of type zero system. The polar plot is a topic of control system ...
12,154 views