Upload date
All time
Last hour
Today
This week
This month
This year
Type
All
Video
Channel
Playlist
Movie
Duration
Short (< 4 minutes)
Medium (4-20 minutes)
Long (> 20 minutes)
Sort by
Relevance
Rating
View count
Features
HD
Subtitles/CC
Creative Commons
3D
Live
4K
360°
VR180
HDR
321 results
In this video, I have plotted the magnitude plot of a transfer function.
47,679 views
6 years ago
Table of Contents: 00:00 - Corners & starting pts 02:36 - Ex 1 Asymptotes 03:53 - Ex 1 Sketch 05:36 - Ex 2 Asymptotes 06:30 - Ex ...
1,055 views
10 years ago
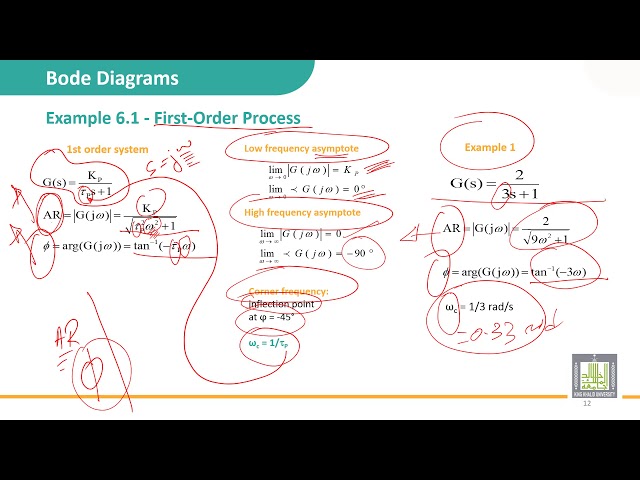
جامعة الملك خالد - عمادة التعلم الإلكتروني المقررات المفتوحة - التحكم الألي Automatic Control الوحدة 6 : Frequency response and Bode ...
1,108 views
... which has it's magnitude plot in the video below: https://www.youtube.com/watch?v=eLOVK-zOYCw Another Bode plot Example ...
49,661 views
7 years ago
This video explains a very simple and accurate method to draw bode plot. it is divided into four part, this video lecture is the part ...
52,298 views
9 years ago
Replaced by: https://youtu.be/gUHmqyKdwYU Here we are exploring what it menas if we do have dead-time elements in the ...
63 views
5 years ago
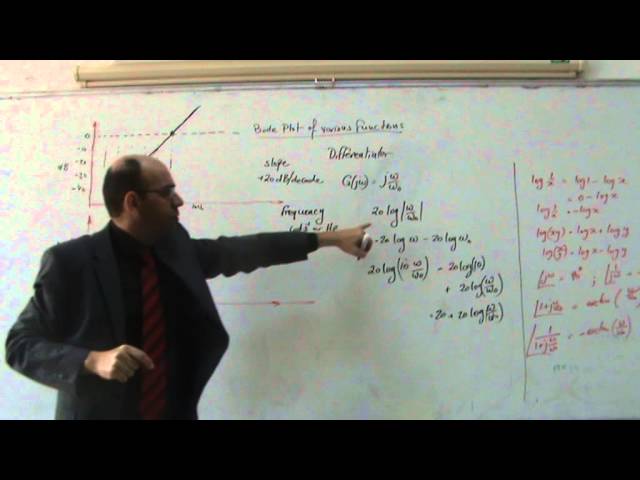
Table of Contents: 00:00 - Example 1 Approximate mag & phase 04:08 - Example 2 Approximate mag & phase 07:10 - Sinusoidal ...
540 views
link to the accompanying pdf document *). This video, which is part of the frequency response methods, develops the Bode plot of ...
9,522 views
11 years ago
How to find the damping ratio of a 2nd order system by looking its bode diagram? Helpful? Please support me on Patreon: ...
55 views
4 years ago
Get instant access to MATLAB & Simulink books, guides, and course files to boost your skills! Get Access Now: ...
335 views
1 year ago
1,807 views
8,446 views
NOTES LINK:
11,852 views
541 views
1,513 views
Building on the last two videos on the resonant frequency, this video presents a worked example of plotting the gain plot for a ...
8,875 views
This video discusses what a Bode Plot is. It shows the logarithmic frequency scale used in both gain and phase plots. It shows ...
24,144 views
1. Define a continuous time system: second and higher order 2. Response plot for step input 3. Response plot for sine input 4.
4,954 views
903 views
Replaced by: https://youtu.be/RiAyG8O56ic This is an example on how to calculate a frequency response. The example is a ...
34 views