Upload date
All time
Last hour
Today
This week
This month
This year
Type
All
Video
Channel
Playlist
Movie
Duration
Short (< 4 minutes)
Medium (4-20 minutes)
Long (> 20 minutes)
Sort by
Relevance
Rating
View count
Features
HD
Subtitles/CC
Creative Commons
3D
Live
4K
360°
VR180
HDR
89,981 results
If you're still using console.log() to find and fix JavaScript issues, you might be spending more time debugging than you need to.
898,782 views
7 years ago
Edebug, instrumenting and stepping and breakpoints. Also macroexpand and how it helps with debugging.
9,359 views
11 years ago
Performance debugging just got a whole lot easier. Learn how our new Chrome DevTools Performance panel is more accessible ...
17,092 views
7 months ago
To watch this keynote interpreted in American Sign Language (ASL), please click here → https://goo.gle/3LYclAp Learn how new ...
29,992 views
3 years ago
https://devtoolsforbeginners.kevinpowell.co/ ✓ https://polypane.app/?ref=kevin (this is an affiliate link, so if you do purchase after ...
21,422 views
4 months ago
Te mostramos cómo depurar un programa en Python 3 utilizando el editor Visual Studio Code. ▻▻ Suscríbete para seguir ...
40,916 views
6 years ago
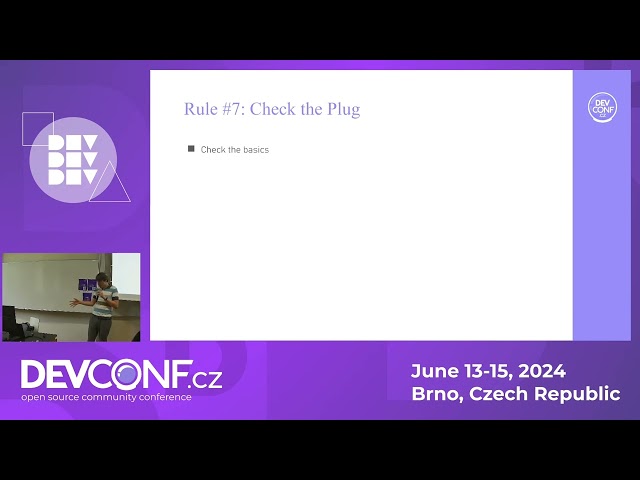
Speaker(s): Martin Schimandl --- In this lightning talk I will present you 9 magic rules that will help you to improve your debugging ...
152 views
1 year ago
Optimizers often push systems to their limits of multidisciplinary analysis, so sometimes solvers don't converge. You can follow a ...
839 views
Interaction to Next Paint (INP) is a Core Web Vital that measures how responsive a page is to interactions. Due to INP's scope, ...
7,642 views
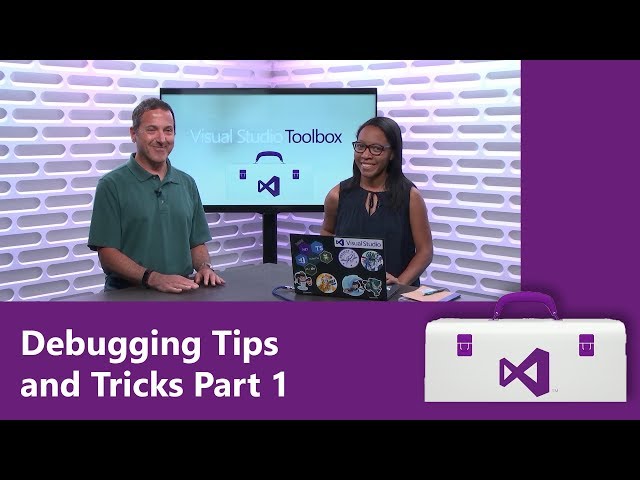
In this episode (part 1 of 2), Robert is joined by Leslie Richardson, who shows several ways you can get the most out of Visual ...
34,030 views
Code used in the video: https://github.com/nilenso/clojure-basics/tree/main/debugging-with-the-repl This is a basic primer on how ...
4,297 views
5 years ago
Developers use frameworks, multiple languages, and libraries to build their web applications. Browsers only see the resulting ...
10,635 views
2 years ago
It is less about squashing bugs but more about answering the question "what happened" that a nasty product manager or ...
2,888 views
8 years ago
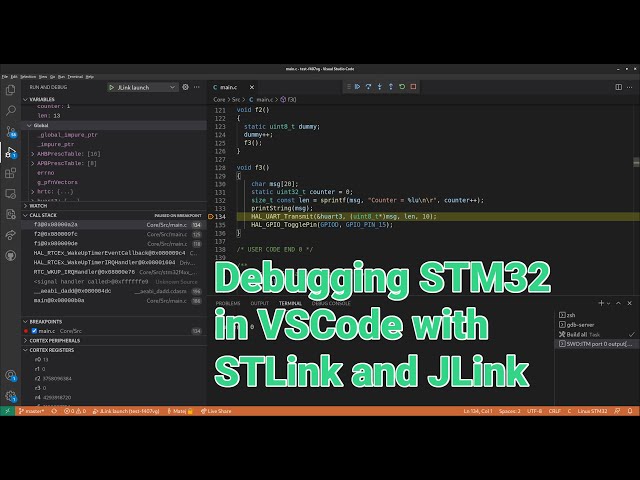
In this video I talk about hardware and software requirements for debugging STM32 in vscode using cortex-debug plugin.
58,880 views
4 years ago
You can watch this class without ads and with quizzes and lab setup instructions by going to https://ost2.fyi/Arch2001.
1,125 views
Full Playlist: https://youtube.com/playlist?list=PLuj2TAdp0tEpLJqkxLd4breqziSp049pZ&si=_pHNWCxbvqk0v2OR 00:00 - Intro ...
6,278 views
In this episode, Robert is joined by Mark Downie, who shows us Time Travel Debugging. provides the ability to record a Web app ...
14,529 views
WebAssembly is a new binary format that allows developers to bring their experience and applications from a variety of ...
28,439 views
This is the story of how I wanted do what I thought was something simple, debugging a Wine app with Ghidra's build in debugger ...
5,575 views
In this first episode on Fortran Debugging I explain the most common types of Failures and Explain the Terminology of Defect ...
2,961 views