Upload date
All time
Last hour
Today
This week
This month
This year
Type
All
Video
Channel
Playlist
Movie
Duration
Short (< 4 minutes)
Medium (4-20 minutes)
Long (> 20 minutes)
Sort by
Relevance
Rating
View count
Features
HD
Subtitles/CC
Creative Commons
3D
Live
4K
360°
VR180
HDR
457 results
Video explains about how to explore datasets using Pandas and Python. for code, Github link: ...
131 views
5 years ago
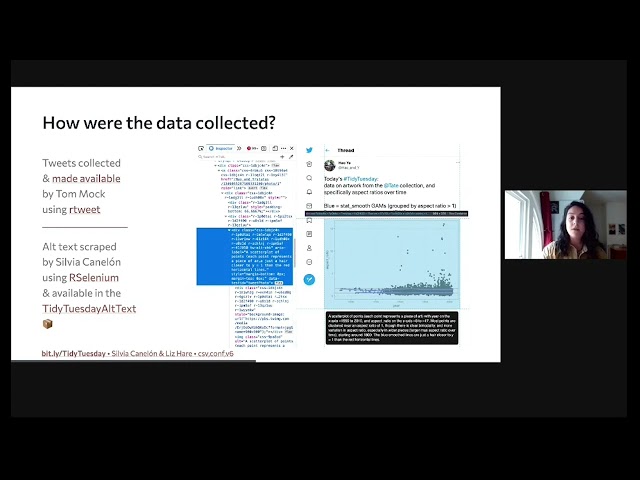
Full title: Revealing Room for Improvement in Accessibility within a Social Media Data Visualization Learning Community ...
329 views
4 years ago
This is a presentation given at the OHBM Open Science Room. It covers what the MNE-Python package is all about and what has ...
1,374 views
Matthieu Garnier, Head of Data & Analytics - Equifax, talks about Social Media Analytics and how social media data can be used ...
24,706 views
6 years ago
Professor Vernon Gayle talks about Jupyter Notebooks. This video is part of the NCRM Online Resources. For supporting ...
1,968 views
8 years ago
Get ready for a shocking combination! In this video, we'll reveal the power of combining Matplotlib and Pandas in Jupyter ...
82 views
1 year ago
In this video, I dive deep into EEG waveform visualization and how we can make it more responsive. I explore the challenges of ...
127 views
In this episode, I build a charting software for my algotrading framework using Lightweight Charts. Lightweight Charts is a free ...
11,026 views
The very basics of creating a Jupyter notebook with text and code cells, and uploading a data file for the notebook to use.
2,272 views
Hey folks! In this video, I delve into the development process of a machine learning algorithm to play an ECG waveform scoring ...
139 views
In this video, I delve into the realm of speech audio transcription and speech analysis using JavaScript. While exploring these ...
56 views
I've taken a lot of courses, maybe too many, but here are the ones I think are worth your time to take. Depending on where you're ...
126,859 views
In this video, I dive into the process of building a custom AI language model, exploring web scraping, JSON data structuring, and ...
161 views
11 months ago
Getting CSV data into a Jupyter Notebook provides plenty of ways to go astray. This example will help you get your first lab data ...
443 views
7 years ago
This segment covers creating a new project, setting up your working directory, and installing/loading the required packages.
6,795 views
3 years ago
Information visualization research has developed powerful systems that enable users to author custom data visualizations without ...
196 views
Step-by-step instructions on analyzing data in the Excel component of the toolkit. Full detail of the toolkit project and links to the ...
92 views
10 years ago
Why don't we teach data cleaning? It has been said that it is difficult to generalize: that what we learn from cleaning Medicare data ...
1,196 views
This workshop-style module provides an introduction to the emerging field of Data Science in R, including data analysis and ...
593 views