Upload date
All time
Last hour
Today
This week
This month
This year
Type
All
Video
Channel
Playlist
Movie
Duration
Short (< 4 minutes)
Medium (4-20 minutes)
Long (> 20 minutes)
Sort by
Relevance
Rating
View count
Features
HD
Subtitles/CC
Creative Commons
3D
Live
4K
360°
VR180
HDR
61 results
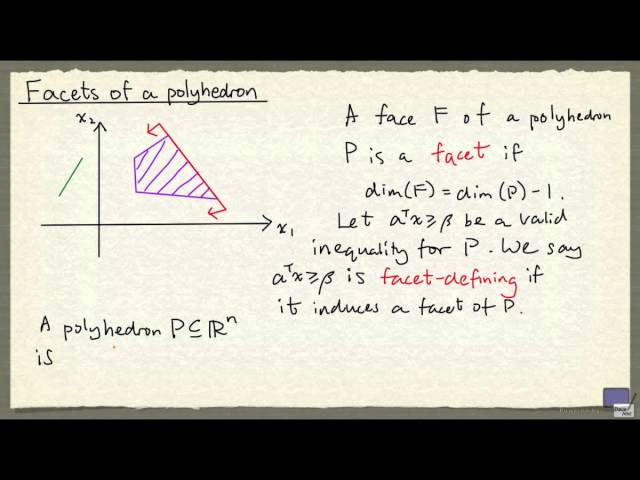
Of course not every face is an affine subspace as this green face shows here. So minimal faces are somewhat special. And so we ...
737 views
10 years ago
Notice that x* satisfies this system of linear equations. But since the rank of this matrix is n, that means x* is the only solution to the ...
7,070 views
2,474 views
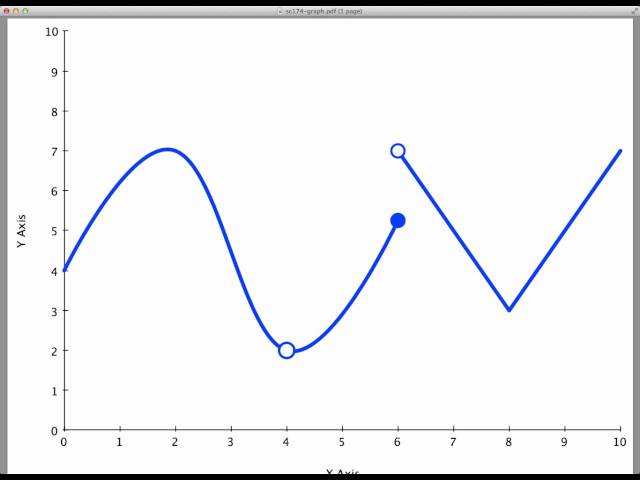
Discusses how to tell where a function is differentiable by examining its graph.
72,732 views
12 years ago
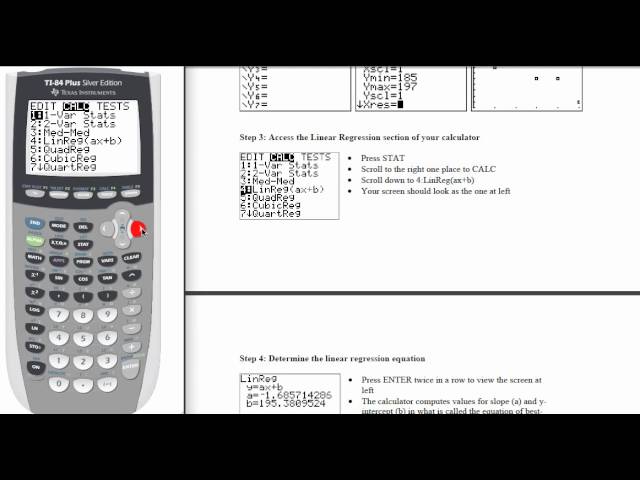
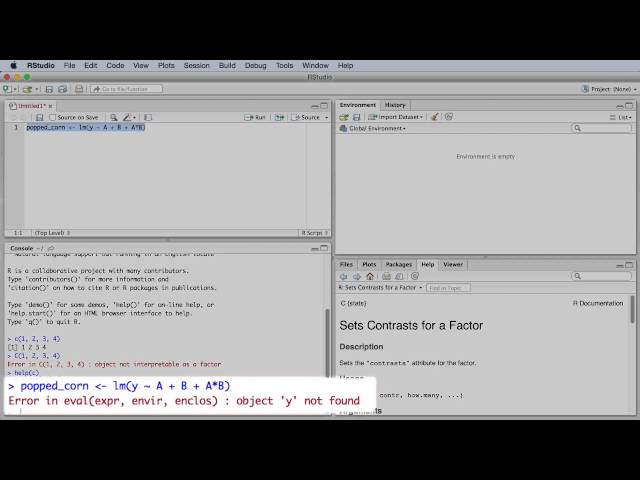
Using a process called linear regression. So the data that we have here should look familiar let's run through the steps again to ...
56,980 views
- The Linear Latent Growth Model is one of the simplest models for modeling effects of time that you can use in SEM and estimate ...
10,600 views
5 years ago
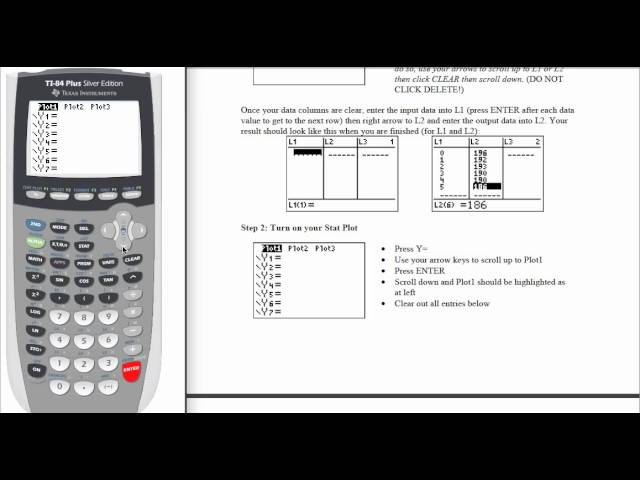
My next step is to graph the data in an appropriate viewing window. To do that I'm gonna first click the window key then I need to ...
14,669 views
This video gives a little bit of information about interpreting the motion based on the position vs time graph, the velocity vs time ...
284,860 views
11 years ago
I use iPhone 17 pro max→ https://amzn.to/3Vr1BB6 This short video provides a brief overview of the #linearschedulingmethod ...
7,274 views
3 years ago
And here we were told that 50 part-time students were asked how many courses they were taking this term. So there's my variable.
458 views
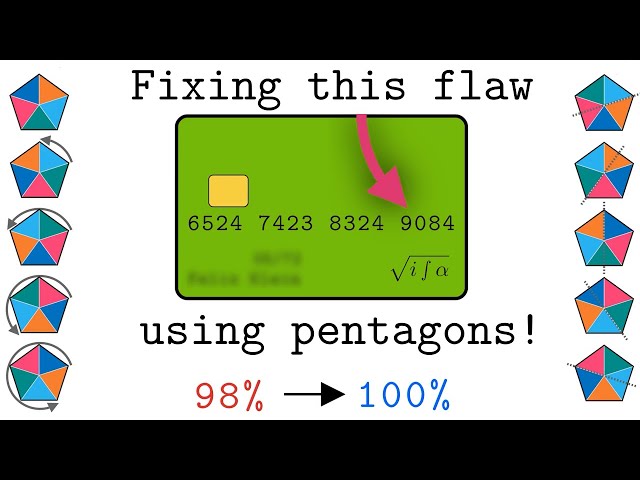
Rediscover and explore the Verhoeff-Gumm algorithm, a check digit formula which is more resilient to common errors than the ...
197,313 views
2 years ago
Contemporary Algebra Collection Topic: Linear Inequalities and Systems, Video 2 of 5 Video Title: Solving Linear Inequalities ...
69 views
Fractals are complex, never-ending patterns created by repeating mathematical equations. Yuliya, a undergrad in Math at MIT, ...
757,697 views
Bar charts are one of the clearest and easiest ways to visualize your data. For more on this topic – and all of data science!
1,700 views
8 years ago
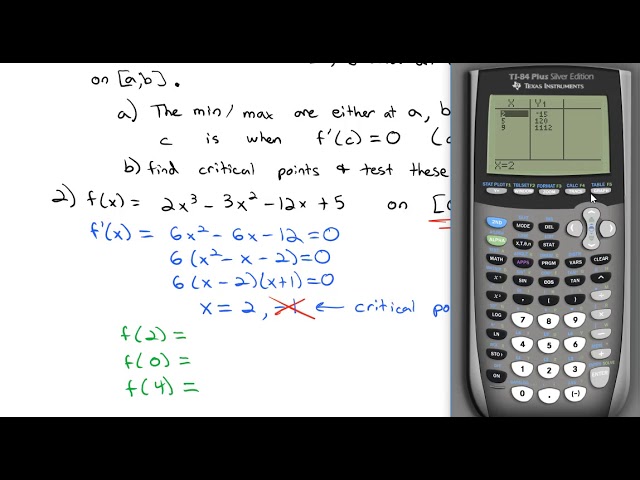
Finding maximum and minimum points using critical points and the extreme value theorem (EVT)
4,224 views
7 years ago
What's the fastest way to drive from Denver to Boston? In this video, we show how a graph can help us find out! Course: Math 301 ...
1,708 views
4 years ago
In this video, we solve a system of linear inequalities in two variables.
533 views
Explaining our work and showing the graph with appropriate labels. So let's use our graphing calculator and let's go to our Y= and ...
7,026 views
In this video, we discuss basic features of Maple (e.g., the difference between text and math mode, plotting and solving an ...
4,484 views
Videos used in the Coursera course: Experimentation for Improvement. Join the course for FREE at ...
7,907 views