Upload date
All time
Last hour
Today
This week
This month
This year
Type
All
Video
Channel
Playlist
Movie
Duration
Short (< 4 minutes)
Medium (4-20 minutes)
Long (> 20 minutes)
Sort by
Relevance
Rating
View count
Features
HD
Subtitles/CC
Creative Commons
3D
Live
4K
360°
VR180
HDR
26 results
If you're still using console.log() to find and fix JavaScript issues, you might be spending more time debugging than you need to.
899,902 views
8 years ago
Developers use frameworks, multiple languages, and libraries to build their web applications. Browsers only see the resulting ...
10,645 views
2 years ago
In this episode (part 1 of 2), Robert is joined by Leslie Richardson, who shows several ways you can get the most out of Visual ...
34,079 views
6 years ago
Why is YAML so hard!? The YAML extension not only helps you write valid YAML, but with schemas, it helps you discover ...
35,669 views
4 years ago
In this video, Sayed Hashimi shows how you can make the most of the debugger in Visual Studio for Mac. He will also ...
7,738 views
Visual Studio Code is a convenient cross-platform environment for writing Rust code. By installing and configuring a few extra ...
9,900 views
We provide a conceptual over of debugging. How to actually debug Java programs using Eclipse will be discussed in later videos ...
4,564 views
9 years ago
Understand how DevTools uses source maps, and how you can disable, configure and load source maps. Chapters: 0:00 Intro ...
26,747 views
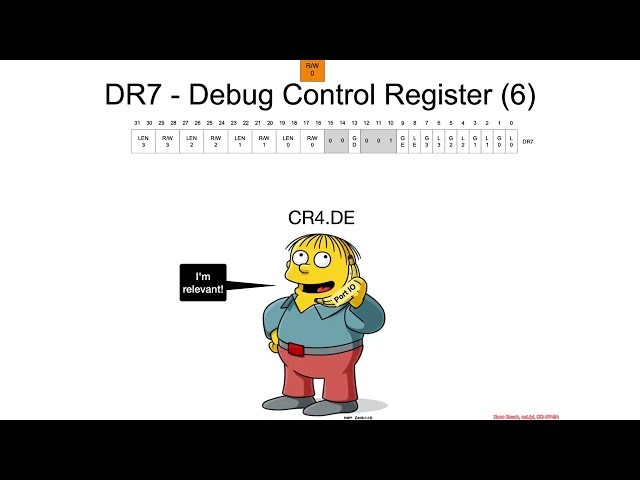
You can watch this class without ads and with extra learning games, quizzes, and lab setup instructions by going to ...
3,788 views
3 years ago
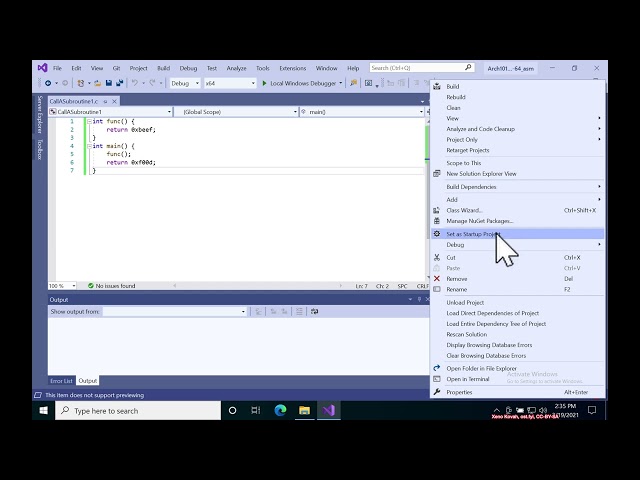
You can watch this class without ads and with quizzes and lab setup instructions by going to https://ost2.fyi/Arch2001.
1,136 views
Installation of the Windows Subsystem for Linux, how to use it with 'zsh', 'Oh My Zsh', and the setup of WSL in Visual Studio Code.
1,094 views
Test UI changes and production fixes with the powerful network response overrides in Chrome DevTools. Mock response headers ...
77,334 views
1 year ago
Have you ever seen the dreaded "service worker can't load its script" error? Do you wonder why your caches don't seem to work?
19,599 views
In this episode of #AskChrome, Kayce and Adam from the Chrome team are here to answer your questions on DevTools.
5,562 views
116 → https://goo.gle/3sWSQUk 117 → https://goo.gle/3rxDaqa Chapters: 0:00 - Introduction 0:14 Mock API with Overrides 1:12 ...
20,970 views
#debugging #print #arduino We will get to the basics of using a simple debugging technique: the print statements. We will work ...
2,787 views
5 years ago
In diesem Video stelle ich euch arguments, apply und call vor und zeige euch, was der Debugger ist. Schau diese Videoserie von ...
4,635 views
11 years ago
Not sure what to do once you start experiencing performance issues in your application after shipping it? Use the profiling tools in ...
46,092 views
Saqib Shaikh, a developer who happens to be blind, shows how he uses Visual Studio 2017 with screen reader software for ...
3,608 views
In this video, we (optionally) configure the MSYS2 zsh-shell with a pretty prompt using 'Oh My Zsh' and the 'agnoster' theme.
3,016 views