Upload date
All time
Last hour
Today
This week
This month
This year
Type
All
Video
Channel
Playlist
Movie
Duration
Short (< 4 minutes)
Medium (4-20 minutes)
Long (> 20 minutes)
Sort by
Relevance
Rating
View count
Features
HD
Subtitles/CC
Creative Commons
3D
Live
4K
360°
VR180
HDR
86 results
In this video, we delve into the common yet perplexing issue of 'Invalid Write' errors encountered in Valgrind, a powerful tool for ...
27 views
7 months ago
[C++ 8.6]: Serie completa http://bit.ly/CppGameDev19 Serie anterior C++: http://bit.ly/CppDev2016-19 Librería TinyPTC UA: ...
1,006 views
5 years ago
[C++ 11.A.5]: Serie completa http://bit.ly/CppGameDev19 Librería TinyPTC UA: http://bit.ly/tinyPTC-UA19 Librería PicoPNG UA: ...
984 views
This is part of the Valgrind and Sanitizers Training, November 1, 2024 ...
36 views
1 year ago
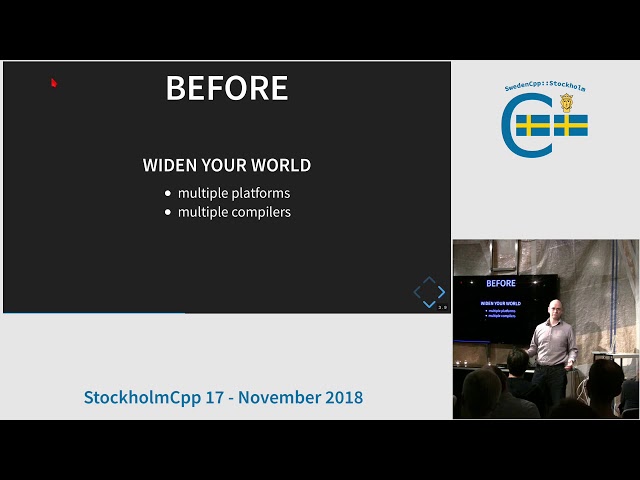
A lightning talk Slides: https://www.pauldreik.se/talks/20181122_debugging_tips/ Recorded at SwedenCpp::Stockholm, ...
328 views
7 years ago
Speakers: Frank Ch. Eigler; Aaron Merey Developers and troubleshooters often need to debug binaries. Often, these binaries are ...
431 views
4 years ago
Why is there a memory leak in this program and how can I solve it, given the constraints (using malloc and free for objects ...
8 views
2 years ago
C++ embedded TCL interpreter possible memory leaks ✧ I really hope you found a helpful solution! ♡ The Content is licensed ...
5 views
9 months ago
by Sébastien Valat At: FOSDEM 2019 https://video.fosdem.org/2019/H.2215/malt_malloc.webm In HPC the memory available is ...
137 views
6 years ago
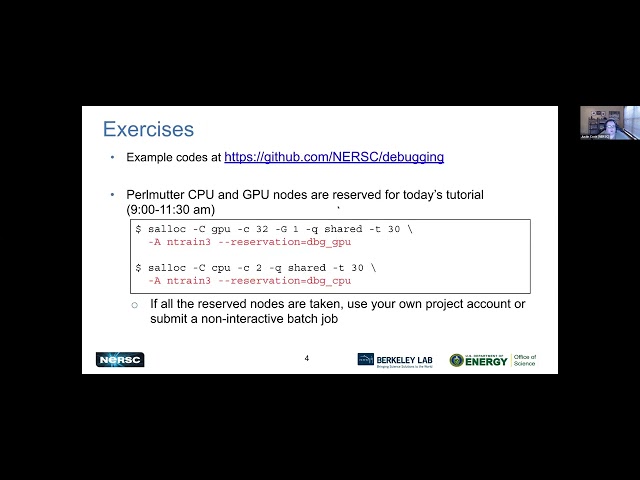
Part of the NERSC New User Training on September 28, 2022. Please see ...
108 views
3 years ago
This is a five-minute flash talk on a proof tool for Linux.
6,856 views
11 years ago
Let's learn about data races! Module details at https://pwn.college/module/race.
1,952 views
Is boost::filesystem thread-safe? I hope you found a solution that worked for you :) The Content is licensed under ...
3 views
L'optimització prematura és l'arrel de tot mal, però l'optimització informada és enginyeria de qualitat. En aquest vídeo explorarem ...
1 view
1 month ago
QML Beginners: https://www.udemy.com/course/qml-for-beginners/?referralCode=3B69B9927B587BBF40F1 Qt Core Beginners: ...
66,643 views
Our first talk of Spooky Pyninsula #27, our second virtual Pyninsula, hosted on October 27, 2020. More info at https://pyninsula.org ...
153 views
Σε αυτό το βίντεο βλέπουμε πως μπορούμε να χρησιμοποιήσουμε το valgrind memcheck για να εντοπίσουμε memory errors σε ...
42 views
Beginner Guide to debugging/dissembling applications with GDB(The GNU Debugger) 0:00 Intro 0:31 Chapter 1 (Basic usage) ...
178 views
View the full free MOOC at https://ost2.fyi/Vulns1001. This class is for C/C++ developers learning secure development, and ...
1,528 views
Let's learn about common causes of memory disclosure vulnerabilities! More info here: pwn.college/modules/memory.
3,348 views


![[Flash Talk] Profiling tool for Linux](/api/proxy/image?url=https%3A%2F%2Fi.ytimg.com%2Fvi%2FY-cnjvgw1KA%2Fsddefault.jpg)


