Upload date
All time
Last hour
Today
This week
This month
This year
Type
All
Video
Channel
Playlist
Movie
Duration
Short (< 4 minutes)
Medium (4-20 minutes)
Long (> 20 minutes)
Sort by
Relevance
Rating
View count
Features
HD
Subtitles/CC
Creative Commons
3D
Live
4K
360°
VR180
HDR
44 results
by Konrad Kleine At: FOSDEM 2020 https://video.fosdem.org/2020/K.4.201/debugging_mini.webm The "official" mini-debuginfo ...
780 views
5 years ago
When debugging C applications, whilst the debugger handles high level operations, it abstracts and offloads lower level ...
273 views
6 years ago
Montreal, QC, September 14, 2015 - Jordi Gutiérrez Hermoso presents PuDB, a full-screen, console-based visual debugger for ...
7,964 views
10 years ago
Many of us spend a lot of time in the debugger, trying to solve the problems. But are LLDB & breakpoints really the only way to ...
503 views
We'll continue analyzing the Signal app on iOS. This time, we add a backtrace to see which functions are accessing the message ...
2,054 views
3 years ago
In this video, we dive into a common issue faced by developers using LLDB: the "Couldn't IRGen Expression" error.
4 views
1 year ago
[SWTT] pwndgb - GDB 및 LLDB 플러그인 아주대학교 김한서.
8 views
2 months ago
See how rr can make your debugging more efficient. This video demonstrates how rr makes it much easier to debug ...
12,747 views
11 years ago
Learn about R's browser() function, very useful to debug your code and the "Tee" pipe operator! In the video, I mention the ...
2,718 views
Aurelien Rougemont from Criteo presents the idea of having an LLDP-like protocol for PDUs. Oh wait ! Slides: ...
28 views
8 months ago
Presented by Simon Marchi at GNU Tools Cauldron 2018 DWARF index sections help significantly reduce the load time of large ...
496 views
7 years ago
You can find the gist I mentioned at https://gist.github.com/nouredd2/349855e034fb4258f9fec015437c212b.
205 views
4 years ago
We are introducing the Visual Studio GDB Debugger that connects the Visual Studio debugger to the GNU Project debugger.
33,078 views
Debugging debuggers!!! By Samy Al Bahra Debuggers are one of the most important tools in the programmer's toolkit, but also ...
517 views
9 years ago
Why Mac users need XCode Command Line Tools for programming and how to install. See all the Fullstack Videos at ...
37,042 views
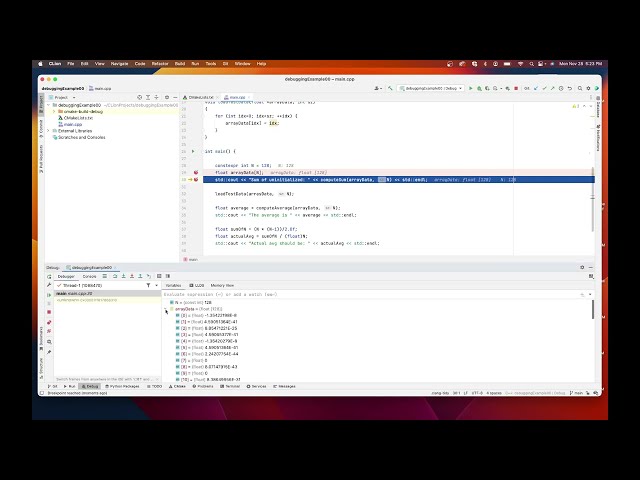
This video is a simple introduction to using the debugger to help you understand how your code is running. It uses CLion on ...
1,714 views
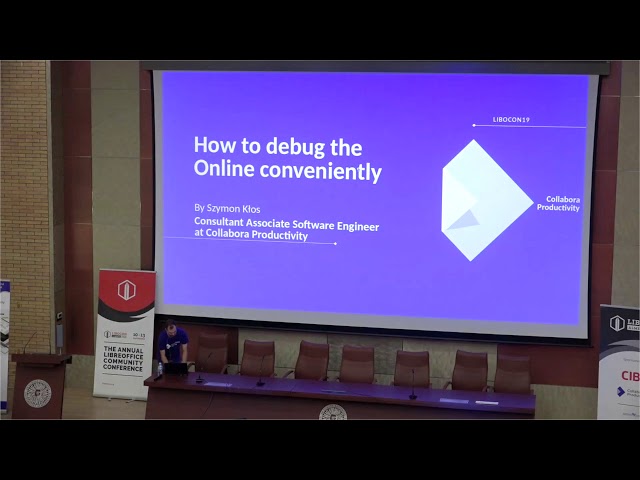
A presentation from the LibreOffice Conference 2019 in Almeria, Spain. Presenter: Szymon Kłos. Conference website: ...
319 views
The class materials are available at http://www.OpenSecurityTraining.info/LifeOfBinaries.html Follow us on Twitter for class news ...
1,524 views
WEEK1 discusses the CPU Organization. To show the general purpose registers and memory modules of the microprocessor, we ...
45 views
WebAssembly is a new binary format that allows developers to bring their experience and applications from a variety of ...
28,524 views


![[0x02] Reversing Shorts :: Backtracing Threads and Adding Symbols with Frida on iOS](/api/proxy/image?url=https%3A%2F%2Fi.ytimg.com%2Fvi%2FpBrhyO-8RYo%2Fsddefault.jpg)

![[SWTT] pwndgb - GDB 및 LLDB 플러그인](/api/proxy/image?url=https%3A%2F%2Fi.ytimg.com%2Fvi%2FDOg_n8xOvY4%2Fsddefault.jpg)