Upload date
All time
Last hour
Today
This week
This month
This year
Type
All
Video
Channel
Playlist
Movie
Duration
Short (< 4 minutes)
Medium (4-20 minutes)
Long (> 20 minutes)
Sort by
Relevance
Rating
View count
Features
HD
Subtitles/CC
Creative Commons
3D
Live
4K
360°
VR180
HDR
292 results
You can find my blog post about animations with Matplotlib here: ...
22,149 views
6 years ago
In this video, we'll dive into the exciting world of data visualization using Plotly in Python. You'll learn how to create an engaging ...
17 views
4 months ago
Full course at: http://johnfoster.pge.utexas.edu/PGE323M-ResEngineeringIII/course-mat.
1,017 views
8 years ago
This video is about plotting images, errorbars, histograms, and composite plots using matplotlib in the Jupyter notebook.
288 views
7 years ago
An introduction to the matplotlib.pyplot plotting package in Python Full course at: http://idl.utsa.edu/me5013.
1,356 views
13 years ago
Good afternoon evening and everything in between as you can tell what we're going to be talking about today is matplotlib the ...
1,144 views
5 years ago
for code, github link: https://github.com/Rohit03111994/Machine-Learning-Project/blob/master/Data_Visualisation_I.ipynb Explore ...
192 views
How to make contour plots, heat maps and other 3d plots using matplotlib.
329 views
3 years ago
ai #python #codanics #artificialintelligence #urdu This complete course is being uploaded here: ...
981 views
2 years ago
... um you can see that i'm importing uh matplotlib already uh from matplotlib.animation i'm importing funk animation uh and then ...
281 views
I write a p5.js program to visualize hundreds of random walks of five steps of north, south, east and west. Run it and modify the ...
708 views
Michel Henon in 1976 introduced the Henon function which describes a transformation rule for a point x, y as follows: x1, y1 maps ...
1,758 views
11 years ago
Python terminal animation Helpful? Please support me on Patreon: https://www.patreon.com/roelvandepaar With thanks & praise ...
63 views
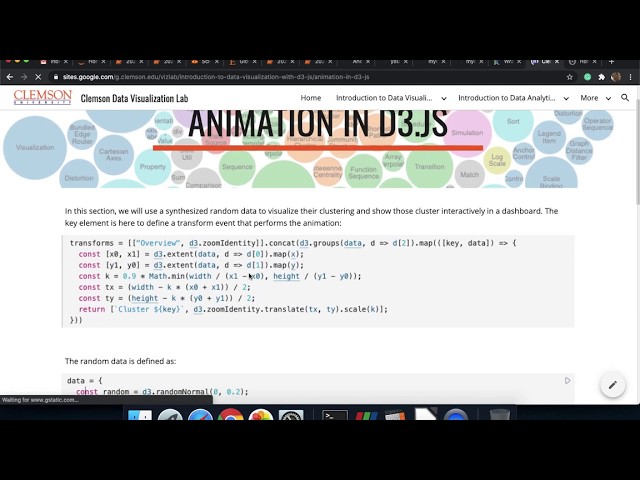
Developing events and simple interactions such as click events and creating animation in D3.js.
69 views
So many things in a simple way with all codes available here ...
331 views
Simple implementation of the Delft3D FLOW hydrodynamic model in the São Sebastião Channel, SP, Brazil. The model is only ...
80 views
9 years ago
msratanagarwal #matplotlib #python How To Plot Line Graph In Python using matplotlib what about the video? How To Plot Line ...
42 views
4 years ago
Presenter: Vidar Tonaas Fauske.
6,472 views
Learn how to use regular expression using re method. In this tutorial, Python re method used are search(), findall(), match(), sub(), ...
1,670 views
In this series I explain how animation works and how to code animated sprites in Python 3 using the Turtle Module. All code and ...
79,914 views