Upload date
All time
Last hour
Today
This week
This month
This year
Type
All
Video
Channel
Playlist
Movie
Duration
Short (< 4 minutes)
Medium (4-20 minutes)
Long (> 20 minutes)
Sort by
Relevance
Rating
View count
Features
HD
Subtitles/CC
Creative Commons
3D
Live
4K
360°
VR180
HDR
2,444 results
Take my Full Python Course Here: https://www.analystbuilder.com/courses/pandas-for-data-analysis In this series we will be ...
116,055 views
2 years ago
Here we go with the series on plotting in python. Matplotlib is a well-known library used for plotting purposes. The series is made ...
74 views
3 years ago
One of the simplest ways to programmatically generate graph visuals is GraphViz. This video explains the basics of GraphViz ...
73,172 views
5 years ago
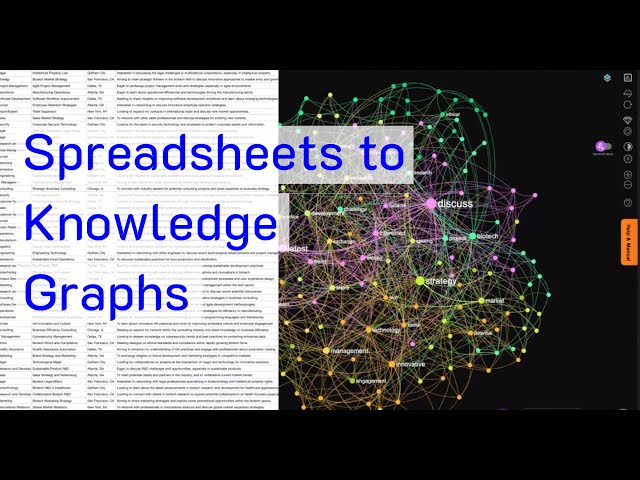
In this video, I am using https://infranodus.com to generate a knowledge graph using LLM. I will show you how you can build a ...
10,802 views
11 months ago
Strengthen your skills in algorithmics and graph theory, and gain experience in programming in Python along the way. To follow ...
3,192 views
7 years ago
3,739 views
3,647 views
by Vincent Cave At: FOSDEM 2020 https://video.fosdem.org/2020/AW1.121/graph_python_scalable_graph_processing.webm ...
159 views
Upload your dataset and automatically get your univariate analysis graphs for your categorical and numerical variables. GitHub ...
290 views
6 years ago
2,856 views
This course was designed to help you get started using Plotly. If you ever felt like your data visualization skills could use an ...
1,903 views
4 years ago
In this video, we'll explore the powerful combination of Python's Pandas library and igraph for data visualization. If you're looking ...
43 views
1 year ago
Implementation of the "Laakso Graph" in Python I hope you found a solution that worked for you :) The Content (except music ...
25 views
This video is a tutorial about how to use PyDigitizer. Two methods are shown: *method 1* : manual selection *method 2* ...
3,145 views
Code Review: Simple Graph in Python Helpful? Please support me on Patreon: https://www.patreon.com/roelvandepaar With ...
3 views
Veusz is Open Source Free software used for scientific plotting and graphing. Python is also Open Source Free software and I ...
4,224 views
12 years ago
For more math, subscribe to my channel: https://www.youtube.com/jeffsuzuki1.
294 views
Montreal, November 11, 2013 -- Using Plotly and iPython for Scientific Graphing by Chris Parmer from Plotly. Source of the ...
33,909 views
If you're fitting a curve or surface to data and want to ever use gradient-based optimizers or Newton solvers, make sure to do it in a ...
976 views
In this video, Tom Ferrara demonstrates how you can use https://infranodus.com AI tool to analyze spreadsheet data with a ...
4,874 views


![Plotly 101 - Graph Objects Intro & Figure Object - [Part 6/8]](/api/proxy/image?url=https%3A%2F%2Fi.ytimg.com%2Fvi%2FsrIU-QglaB0%2Fsddefault.jpg)