Upload date
All time
Last hour
Today
This week
This month
This year
Type
All
Video
Channel
Playlist
Movie
Duration
Short (< 4 minutes)
Medium (4-20 minutes)
Long (> 20 minutes)
Sort by
Relevance
Rating
View count
Features
HD
Subtitles/CC
Creative Commons
3D
Live
4K
360°
VR180
HDR
16,108 results
Edebug, instrumenting and stepping and breakpoints. Also macroexpand and how it helps with debugging.
9,408 views
11 years ago
If you're still using console.log() to find and fix JavaScript issues, you might be spending more time debugging than you need to.
905,353 views
8 years ago
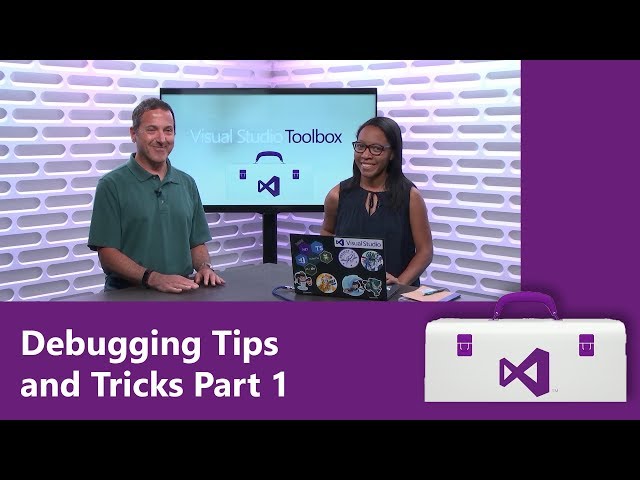
In this episode (part 1 of 2), Robert is joined by Leslie Richardson, who shows several ways you can get the most out of Visual ...
34,300 views
6 years ago
Optimizers often push systems to their limits of multidisciplinary analysis, so sometimes solvers don't converge. You can follow a ...
880 views
3 years ago
Barry joins Jecelyn again to explain how to record a trace in the Performance panel and debug LCP and CLS issues using the ...
32,638 views
1 year ago
Beginner Guide to debugging/dissembling applications with GDB(The GNU Debugger) 0:00 Intro 0:31 Chapter 1 (Basic usage) ...
181 views
4 years ago
Visual Studio's debugger is an incredible powerful tool which can make your life a lot easer - if you know how to use it. This short ...
1,202 views
Code used in the video: https://github.com/nilenso/clojure-basics/tree/main/debugging-with-the-repl This is a basic primer on how ...
4,324 views
5 years ago
Code used in the video: https://github.com/nilenso/clojure-basics/tree/main/scientific-debugging Scientific debugging is a ...
1,546 views
Developers use frameworks, multiple languages, and libraries to build their web applications. Browsers only see the resulting ...
10,715 views
2 years ago
Curious how software cracks actually work? In this video, I walk you through a beginner‑friendly reverse‑engineering challenge ...
17,601 views
7 months ago
Montreal, QC, September 14, 2015 - Jordi Gutiérrez Hermoso presents PuDB, a full-screen, console-based visual debugger for ...
7,982 views
10 years ago
Performance debugging just got a whole lot easier. Learn how our new Chrome DevTools Performance panel is more accessible ...
19,655 views
9 months ago
As you become more proficient with WordPress development, you'll find that sometimes things don't work as expected, and you ...
2,110 views
In this first episode on Fortran Debugging I explain the most common types of Failures and Explain the Terminology of Defect ...
2,981 views
Learn how to debug your web app effectively with Chrome DevTools. Inspect and modify components, create watch expressions ...
41,871 views
Optimization of complicated multidisciplinary systems is not easy. By following this systematic debugging procedure you can ...
1,708 views
In this episode, Robert is joined by Mark Downie, who shows us Time Travel Debugging. provides the ability to record a Web app ...
14,562 views
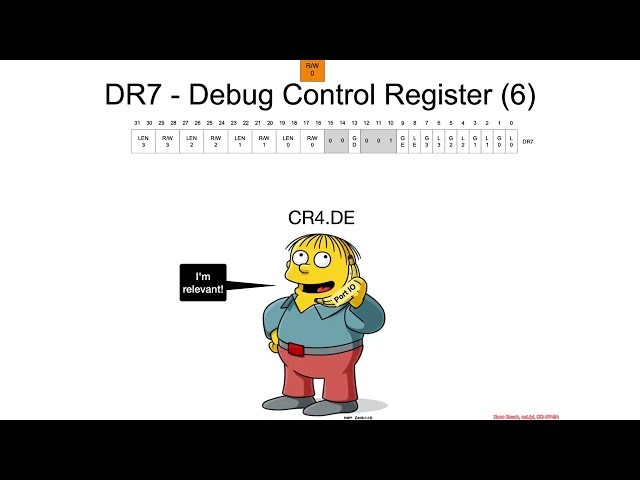
You can watch this class without ads and with quizzes and lab setup instructions by going to https://ost2.fyi/Arch2001.
1,182 views
Interaction to Next Paint (INP) is a Core Web Vital that measures how responsive a page is to interactions. Due to INP's scope, ...
7,845 views