Upload date
All time
Last hour
Today
This week
This month
This year
Type
All
Video
Channel
Playlist
Movie
Duration
Short (< 4 minutes)
Medium (4-20 minutes)
Long (> 20 minutes)
Sort by
Relevance
Rating
View count
Features
HD
Subtitles/CC
Creative Commons
3D
Live
4K
360°
VR180
HDR
322 results
Building on the last two videos on the resonant frequency, this video presents a worked example of plotting the gain plot for a ...
8,913 views
12 years ago
In this video, I have plotted the magnitude plot of a transfer function.
49,847 views
6 years ago
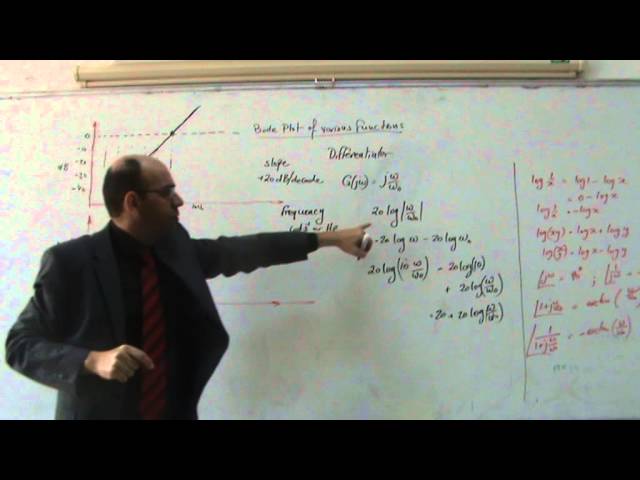
En este caso pues sería 20 logaritmos de cada 0 cuales pues entonces si tenemos un diagrama de bode y nos fijamos las ...
429 views
4 years ago
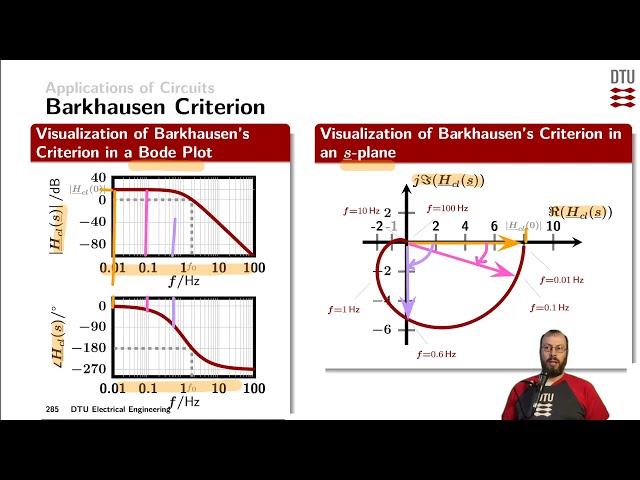
oscillation loop modeling, open loop, closed loop, oscillation criterion, Bode plot, s-plane by Arnold Knott, Technical University of ...
176 views
5 years ago
Get instant access to MATLAB & Simulink books, guides, and course files to boost your skills! Get Access Now: ...
475 views
1 year ago
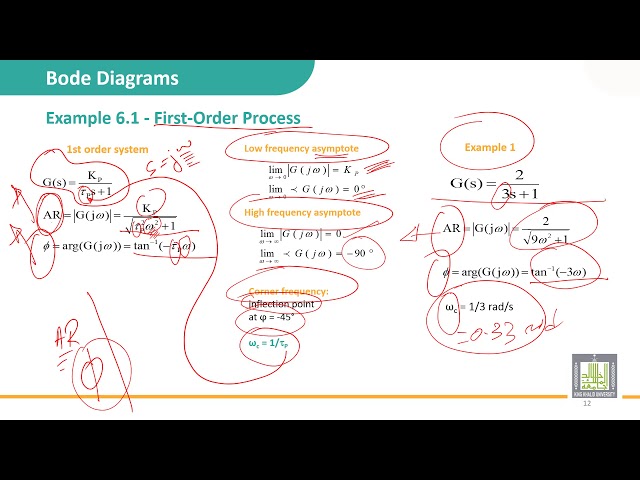
Table of Contents: 00:00 - Corners & starting pts 02:36 - Ex 1 Asymptotes 03:53 - Ex 1 Sketch 05:36 - Ex 2 Asymptotes 06:30 - Ex ...
1,067 views
11 years ago
جامعة الملك خالد - عمادة التعلم الإلكتروني المقررات المفتوحة - التحكم الألي Automatic Control الوحدة 6 : Frequency response and Bode ...
1,130 views
7 years ago
1,567 views
9 years ago
This video explains a very simple and accurate method to draw bode plot. it is divided into four part, this video lecture is the part ...
52,485 views
link to accompanying pdf document below *). This video is the third video of three videos that develop the Bode plot for a lag ...
4,188 views
Table of Contents: 00:00 - Example 1 Approximate mag & phase 04:08 - Example 2 Approximate mag & phase 07:10 - Sinusoidal ...
554 views
... which has it's magnitude plot in the video below: https://www.youtube.com/watch?v=eLOVK-zOYCw Another Bode plot Example ...
51,932 views
1. Define a continuous time system: second and higher order 2. Response plot for step input 3. Response plot for sine input 4.
4,971 views
link to the accompanying pdf document *). This video, which is part of the frequency response methods, develops the Bode plot of ...
9,595 views
917 views
link to the accompanying pdf document below *). This video is the second in the series on frequency response methods.
9,007 views
link to the accompanying pdf document *). This video on frequency response methods shows how the Bode plot is generated for a ...
5,599 views
link to accompanying pdf document *). This video is the second video of three videos that develop the Bode plot for a lag network.
4,460 views
8,870 views
1,864 views