Upload date
All time
Last hour
Today
This week
This month
This year
Type
All
Video
Channel
Playlist
Movie
Duration
Short (< 4 minutes)
Medium (4-20 minutes)
Long (> 20 minutes)
Sort by
Relevance
Rating
View count
Features
HD
Subtitles/CC
Creative Commons
3D
Live
4K
360°
VR180
HDR
347 results
How to make animated plot (animated chart) with Matplotlib and Python programming Language. In this tutorial, an animated plot ...
24,828 views
4 years ago
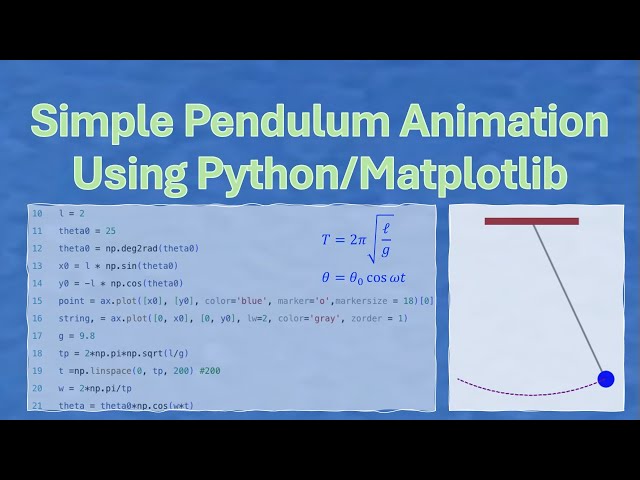
In this video, you will learn how to write a python program to do the animation of a simple pendulum. Step by step instructions are ...
23 views
1 month ago
In this video Rob, a Kaggle Grandmaster, quickly and humorously walks through each of the popular plotting and data ...
109,905 views
Source code: https://gist.github.com/syphh/9fa861563977e2cbbf4ddea518677b0a Learn graph theory algorithms: ...
1,222 views
Textbooks: https://amzn.to/2VmpDwK https://amzn.to/2GQSV3D https://amzn.to/2SvTOQx Welcome to Engineering Python. This is ...
1,310 views
8 years ago
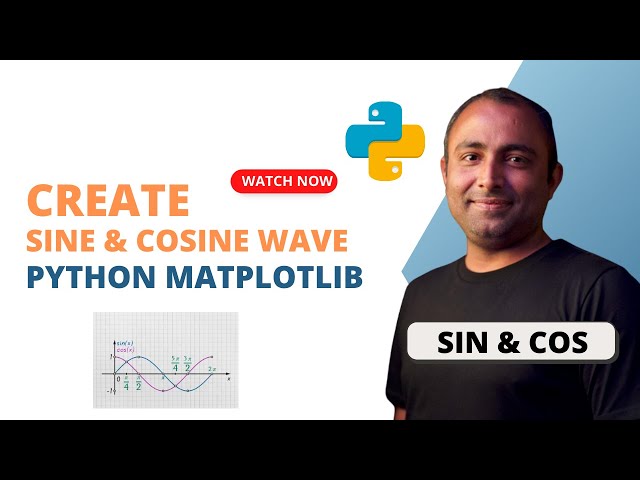
In this video, we will visualize the sine and cosine waves using Python's Matplotlib library. The video showcases a dynamic ...
843 views
2 years ago
In this video, we are going to learn about how to create a responsive bar chart animations in 3 lines of code using our favourite ...
727 views
5 years ago
In the ever-evolving world of data visualization, scatterplot animation has emerged as a captivating and powerful tool to breathe ...
180 views
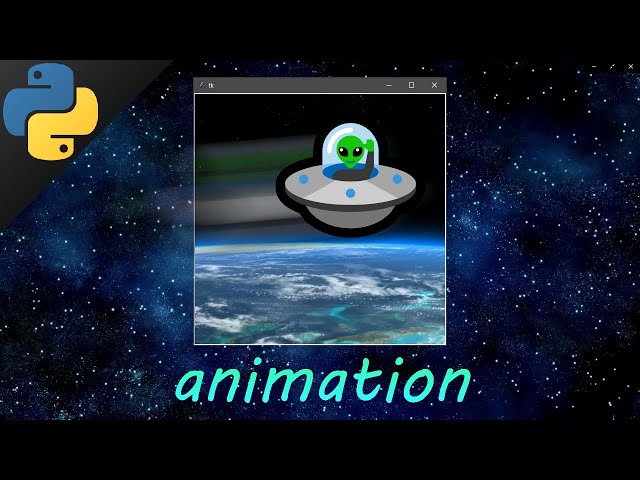
Python tkinter animation animations canvas tkinter GUI tutorial #Python #tkinter #animation #animations #canvas #GUI #tutorial.
59,211 views
Python tkinter animation animate multiple objects tutorial for beginners #Python #tkinter #animation #animate #multiple #objects ...
43,207 views
GoPro #Python #metadata 日本語版はコチラ: https://youtu.be/Ebd_GTNwWac My previous Youtube video about the effects of the ...
200 views
Data analysis using Python; https://ibm.biz/Using_Python Beginner's guide to python; https://ibm.biz/Python_for_beginners If ...
269,389 views
Matplotlib is used to customize visuals and create animation and Seaborn is used to create exploratory charts like Heat map ...
865 views
by LEE YUAN HOOI In today's digital world where Industry 4.0 brought up the fourth industrial revolution with the utilization of ...
155 views
... um you can see that i'm importing uh matplotlib already uh from matplotlib.animation i'm importing funk animation uh and then ...
281 views
Let's Make Desktop Applications With Animation Using Python Tkinter. You Can Make Applications Containing Animation Using ...
3,248 views
3 years ago
Do you know how to animate the ball object using Python Tkinter? You can animate the ball object using Python Tkinter.
1,886 views
Let's join Elsa and Anna in their latest quest to the Enchanted Forest. You'll be introduced to: - Programming languages for data ...
2,362 views
Looking to get better at Blender Python? Go here: https://cgpython.com/skool/109 This is the fifth video in the Color Slices Tutorial ...
472 views
Hello Everyone! Today in this video I am going to step-by-step guide you on How to install Matplotlib on Python 3.11.2 on ...
91,283 views
Welcome to a Matplotlib with Python 3+ tutorial series. In this series, we're going to be covering most aspects to the Matplotlib data ...
701,199 views
10 years ago
Master Python through Creative Projects! Learn to Build Cool Apps with Step-by-Step Tutorials! Welcome to the ultimate Python ...
10 views
6 months ago
Today's video provides a conceptual overview of Monte Carlo simulation, a powerful, intuitive method to solve challenging ...
412,395 views
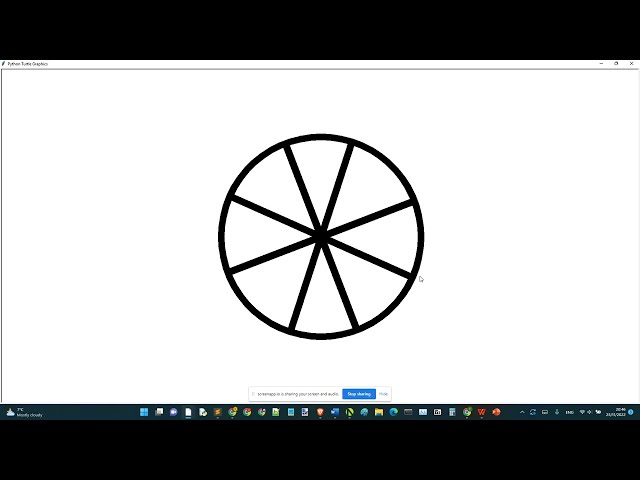
Warning: If the speed is a multiple of 180, the wheel will not spin at all. If you make the speed larger than 10, there is a risk of the ...
3,260 views
Mastering Curvature Calculations in Python! In this comprehensive Python tutorial, we dive deep into the concept of ...
114 views
1 year ago


![How to Install Matplotlib on Python 3.11.2 on Windows 11 [ 2023 Update ] Complete Guide](/api/proxy/image?url=https%3A%2F%2Fi.ytimg.com%2Fvi%2FEmBntQAnWyc%2Fsddefault.jpg)