Upload date
All time
Last hour
Today
This week
This month
This year
Type
All
Video
Channel
Playlist
Movie
Duration
Short (< 4 minutes)
Medium (4-20 minutes)
Long (> 20 minutes)
Sort by
Relevance
Rating
View count
Features
HD
Subtitles/CC
Creative Commons
3D
Live
4K
360°
VR180
HDR
200 results
► The PYTHON package matplotlib 📊 allows you to create basic visualizations in a simple way. In this video, we'll see how to ...
81,542 views
5 years ago
Learn to plot graphs in Python in this tutorial! We cover matplotlib and show you how to get an awesome looking plot. As part of ...
56,215 views
We are highly visual creatures; we understand things better when we see them visualized. However, the step of presenting ...
69,358 views
7 years ago
Create scatter plot with python, jupyter notebook, pandas and matplotlib using pyplot.plot What you will learn: 1. Create dataframe ...
276 views
6 years ago
Hello Everyone! Today in this video I am going to step-by-step guide you on How to install Matplotlib on Python 3.11.2 on ...
90,531 views
2 years ago
In this video, I am going to talk about MATPLOTLIB and its usage in python. It is a very popular package used to create ...
23 views
4 years ago
In this video, learn how to install matplotlib on Windows. We will also install Python 3 and pip. PIP is used to install and manage ...
2,393 views
2 months ago
In this video Rob, a Kaggle Grandmaster, quickly and humorously walks through each of the popular plotting and data ...
109,149 views
box #programming #python In this video, it is informed that box plot is generated to assess the percentile of data distribution from ...
265 views
Matplotlib label bars with values. In this video we will talk about how to add data labels to bar chart in matplotlib in python ...
10,431 views
3 years ago
In this Python Matplotlib Tutorial, I will show step-by-step how to adjust the height of subplots using Matplotlib. Here I also explain, ...
652 views
In this tutorial, we will learn how to create charts in Python using the PyPlot library. We will be using Google Colab for Python ...
703 views
Intro to Data Analysis Visualization with Python, Matplotlib and Pandas: Introduction and Overview: Time series and forecasting ...
6,340 views
Textbooks: https://amzn.to/2VmpDwK https://amzn.to/2GQSV3D https://amzn.to/2SvTOQx Welcome to Engineering Python. This is ...
1,534 views
8 years ago
1,309 views
3,237 views
Tutorial on how to add value labels on a matplotlib bar chart (above each bar) in Python Programming Language ...
19,089 views
This is the video followed the numpy select video. Basically it's just showing the histogram of the daily return. What I want to show ...
225 views
Short but accurate guide to setup matplotlib on a computer running Windows Operating System. It uses 'pip'. SUMMARY: 1.
150,390 views
9 years ago
An introduction to Matplotlib and Seaborn, two key libraries for plotting data in Python. We also introduce the notion of EDA, ...
412 views
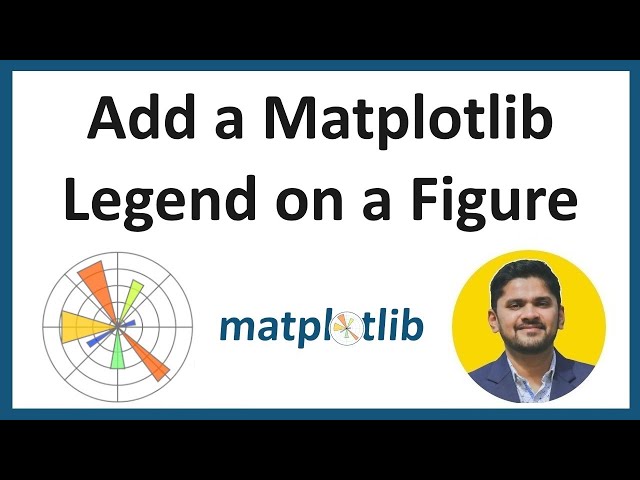
In this lesson, learn how to add a Matplotlib Legend in a Graph. A legend in a graph is a box on the left and right displaying the ...
3,573 views
6,395 views
In this lesson, learn to plot titles and position them in Matplotlib. To set the titles in a graph, use the title() function in Matplotlib.
3,327 views
📚 Join more than professionals in our course: https://www.udemy.com/course/visualizacion-de-datos-en-python-matplotlib-g ...
3,321 views
By default when you plot, the graph in Matplotlib it is plotted with the solid line style. But you can change the line properties in ...
395 views
![How to use MATPLOTLIB to make graphs 🐍💻 [Python Data Science Course in Spanish]](/api/proxy/image?url=https%3A%2F%2Fi.ytimg.com%2Fvi%2FXEG4eh5l_qU%2Fsddefault.jpg)


![How to Install Matplotlib on Python 3.11.2 on Windows 11 [ 2023 Update ] Complete Guide](/api/proxy/image?url=https%3A%2F%2Fi.ytimg.com%2Fvi%2FEmBntQAnWyc%2Fsddefault.jpg)

![How to Install Matplotlib with latest Python 3.14 on Windows 10/11 [2025 Update] Matplotlib Tutorial](/api/proxy/image?url=https%3A%2F%2Fi.ytimg.com%2Fvi%2FJqTjyPhRHMw%2Fsddefault.jpg)


![[Part 3] Plotting data with Python](/api/proxy/image?url=https%3A%2F%2Fi.ytimg.com%2Fvi%2FSQgrAdeZcLg%2Fsddefault.jpg)