Upload date
All time
Last hour
Today
This week
This month
This year
Type
All
Video
Channel
Playlist
Movie
Duration
Short (< 4 minutes)
Medium (4-20 minutes)
Long (> 20 minutes)
Sort by
Relevance
Rating
View count
Features
HD
Subtitles/CC
Creative Commons
3D
Live
4K
360°
VR180
HDR
7,801 results
► The PYTHON package matplotlib 📊 allows you to create basic visualizations in a simple way. In this video, we'll see how to ...
84,727 views
5 years ago
We are highly visual creatures; we understand things better when we see them visualized. However, the step of presenting ...
70,318 views
7 years ago
Data analysis using Python; https://ibm.biz/Using_Python Beginner's guide to python; https://ibm.biz/Python_for_beginners If ...
287,078 views
3 years ago
Earn your Python Certificate → https://ibm.biz/Bdy8Eb NumPy and SciPy are two Python libraries that on the surface, appear to ...
71,560 views
2 years ago
Our intro to Matplotlib in Python, focusing on how to turn raw data into beautiful plots. We start by creating basic plots, then builds ...
7,947 views
3 months ago
In this video Rob, a Kaggle Grandmaster, quickly and humorously walks through each of the popular plotting and data ...
113,012 views
4 years ago
Learn to plot graphs in Python in this tutorial! We cover matplotlib and show you how to get an awesome looking plot. As part of ...
63,215 views
📚 Join more than professionals in our course: https://www.udemy.com/course/visualizacion-de-datos-en-python-matplotlib-g ...
3,419 views
Short but accurate guide to setup matplotlib on a computer running Windows Operating System. It uses 'pip'. SUMMARY: 1.
150,418 views
9 years ago
Aprende NumPy en Python desde cero, la librería clave para Data Science y Machine Learning. Suscríbete!! más contenido como ...
10,115 views
1 year ago
Visualization is central to the process of how we think. This video reviews the inner workings of Python's most popular plotting ...
3,933 views
Master AI from Zero to Advanced: https://ailearninghub.io ------------------------- In this video, you'll learn how to create and customize ...
246 views
In this video Kaggle Grandmaster Rob shows you how to use python and librosa to work with audio data. We import play and ...
230,746 views
See how to use Matplotlib to create charts. Watch the Python for Beginner series here: https://aka.ms/PythonBeginnerSeries For ...
3,424 views
6 years ago
Python tkinter animation animations canvas tkinter GUI tutorial #Python #tkinter #animation #animations #canvas #GUI #tutorial.
61,877 views
Mastering Data Visualization: Crafting Stunning Bar Plots with Matplotlib and Seaborn! how to create a barplot// barplot using ...
66 views
An introduction to Matplotlib and Seaborn, two key libraries for plotting data in Python. We also introduce the notion of EDA, ...
429 views
Using Python and curious how to use it with Power BI? Patrick explores how you can do just that! Python + Power BI can be a ...
391,800 views
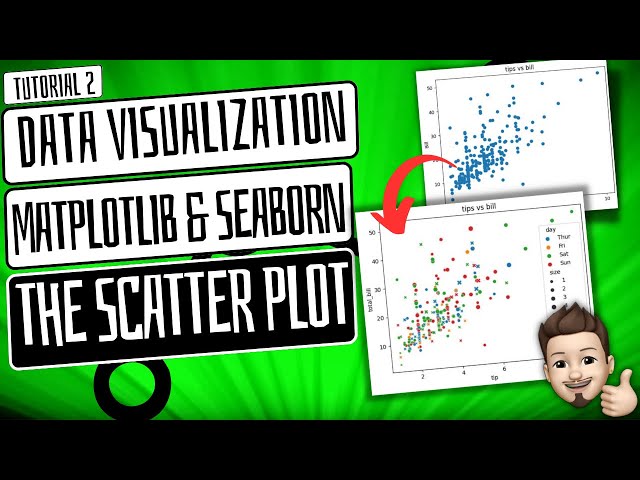
Mastering Data Visualization: Crafting Stunning Scatter Plots with Matplotlib and Seaborn! how to create a scatterplot ...
115 views
How to use Python in Excel natively using libraries like Pandas, NumPy, Matplotlib, Seaborn and more. In this video I'll show you ...
249,966 views
![How to use MATPLOTLIB to make graphs 🐍💻 [Python Data Science Course in Spanish]](/api/proxy/image?url=https%3A%2F%2Fi.ytimg.com%2Fvi%2FXEG4eh5l_qU%2Fsddefault.jpg)


![Demo: Visualizing data with Matplotlib | Even More Python for Beginners [30 of 31]](/api/proxy/image?url=https%3A%2F%2Fi.ytimg.com%2Fvi%2FhpkwQtOGA1Y%2Fsddefault.jpg)

![[Part 3] Plotting data with Python](/api/proxy/image?url=https%3A%2F%2Fi.ytimg.com%2Fvi%2FSQgrAdeZcLg%2Fsddefault.jpg)