Upload date
All time
Last hour
Today
This week
This month
This year
Type
All
Video
Channel
Playlist
Movie
Duration
Short (< 4 minutes)
Medium (4-20 minutes)
Long (> 20 minutes)
Sort by
Relevance
Rating
View count
Features
HD
Subtitles/CC
Creative Commons
3D
Live
4K
360°
VR180
HDR
29,760 results
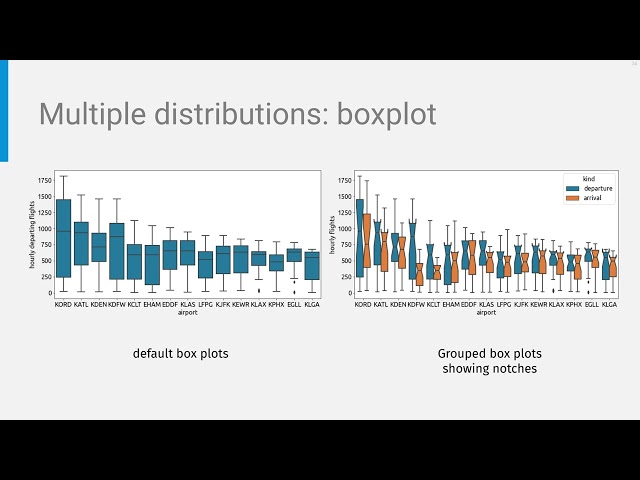
In this video Rob, a Kaggle Grandmaster, quickly and humorously walks through each of the popular plotting and data ...
109,711 views
4 years ago
Welcome to 'Python for Data Science' course ! This video introduces the essentials of data visualization using the powerful ...
109,493 views
6 years ago
New course: Learn Python in Excel — already 2500+ enrolled. Solve real data problems, right inside Excel ...
168,017 views
9 months ago
Master Python and Build Awesome AI Projects https://python-course-earlybird.framer.website/?&utm_source=pyvizdash ...
584,226 views
3 years ago
Review code better and faster with my 3-Factor Framework: https://arjan.codes/diagnosis. In this video, I'll share five essential tips ...
37,051 views
1 year ago
New course: Learn Python in Excel — already 3000+ enrolled. Solve real data problems, right inside Excel ...
361,744 views
8 months ago
Get Python Certification→ https://ibm.biz/BdPZLr Get Certified in R →https://ibm.biz/BdPZLs Python and R are both common and ...
406,505 views
A video lecture from the online course "AI Skills for Engineers: Data Engineering and Data Pipelines" To learn more about this ...
495 views
2 years ago
Review code better and faster with my 3-Factor Framework: https://arjan.codes/diagnosis. In this video, I'll share 15 Python ...
456,084 views
Data Analyst Roadmap 2026. A data analyst career path can be broken down into 3 simple steps with timelines so that it's easy to ...
1,059,457 views
Setup, conflict, resolution. You know right away when you see an effective chart or graphic. It hits you with an immediate sense of ...
630,080 views
Intro to Data Analysis Visualization with Python, Matplotlib and Pandas: Introduction and Overview: Time series and forecasting ...
6,362 views
Learn Python inside Excel — Save $130 for a limited time Early access ends July 7 – Price goes up after ...
1,938,648 views
MENTORSHIP – Ready to become a standout data analyst? Applications for the March 2026 cohort are now open! Apply here ...
101,469 views
1 month ago
MENTORSHIP – Applications for the March 2026 cohort are now open! Apply here → https://theanalyticsaccelerator.com/ We're ...
47,608 views
10 months ago
Curious about a career in Data Analytics? Book a call with a program advisor: https://bit.ly/47LEBk3 Looking to get started in Data ...
153,369 views
Forget Python for data cleaning, Excel can do this faster. Power Query course: https://bit.ly/pythonexcel25course ...
56,419 views
11 months ago
In this tutorial, we will learn how to create charts in Python using the PyPlot library. We will be using Google Colab for Python ...
708 views
Python data visualization quick start for beginners #python #visualization #pythonprogramming #pythonforbeginners ...
34 views
In this Python Data Visualization tutorial, learn all there is to know about data visualizations in Matplotlib, Seaborn and Bokeh.
72 views