Upload date
All time
Last hour
Today
This week
This month
This year
Type
All
Video
Channel
Playlist
Movie
Duration
Short (< 4 minutes)
Medium (4-20 minutes)
Long (> 20 minutes)
Sort by
Relevance
Rating
View count
Features
HD
Subtitles/CC
Creative Commons
3D
Live
4K
360°
VR180
HDR
38,265 results
In this video we take a look at the best resources to learn Data Visualization in 2025! 25% off Analyst Builder Code: ...
17,788 views
1y ago
... Data Analysis Specialization - https://coursera.pxf.io/AoYOdR Tableau Data Visualization - https://coursera.pxf.io/MXYqaN ...
131,545 views
3y ago
A short introduction to the core concepts of data visualization and their application to network biology. The presentation provides a ...
4,896 views
5y ago
This segment covers the basics of creating ggplot objects. Course Description: This 1-hour course teaches students to create ...
1,774 views
4y ago
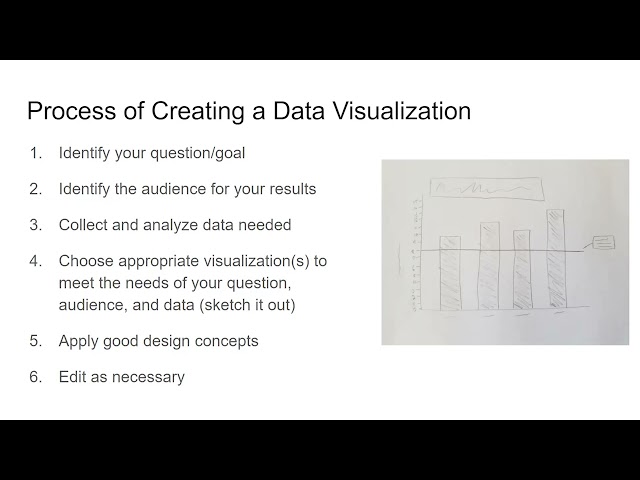
Presented by Tess Grynoch. This video is part of a series of lectures recorded to teach about basic data visualization concepts.
31 views
This segment covers downloading and importing the dataset. Course Description: This 1-hour course teaches students to create ...
2,421 views
Presented by David Christensen. This video is part of a series of lectures recorded to teach about basic data visualization ...
344 views
Overview of the course found here: https://curran.github.io/dataviz-course-2018/
15,361 views
8y ago
Short tutorial on how to set up a basic data visualization in Microsoft's Power BI.
13,125 views
9y ago
Our goal for creating Viz was to have a beginner-friendly library for visualizing data. Thus, our focus was mainly on building ...
636 views
Hello everyone! In todays video I want to show you how you can use Obsidian for data visualization by using Obsidian Charts, ...
31,222 views
2y ago
In this lesson, we will explore three essential aspects of creating effective visual representations of data. We'll begin by discussing ...
15 views
250,015 views
Why does data visualization matter? Simply put, data visualization, or data vis, does three things for us: it enables us to better ...
504 views
6y ago
Introduction to network analysis and visualization with GEPHI. Datasets and tutorial here: ...
123,522 views
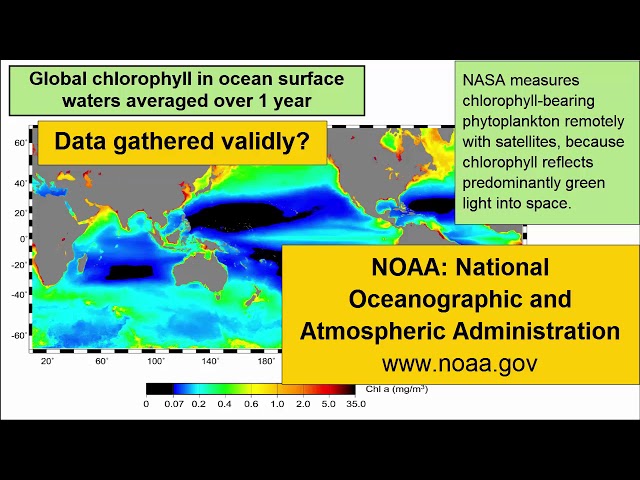
For an introductory college-level earth sciences class: a review of how to read and critically evaluate data visualizations such as ...
9,687 views
Discussion about what makes visualizations beautiful and truthful. Access the slides, code, and other materials at the course ...
1,187 views
This video explains how to visualize data in R using the ggplot2 package. Specifically, I show how to make a boxplot and a ...
265 views
Introduction to data visualization workshops in "action"
87 views
This tutorial delves into the foundational tools (e.g., Matplotlib, Seaborn, Pandas)for data visualization in Python. We'll explore bar ...
608 views