ViewTube

ViewTube
Sign inSign upSubscriptions
Filters

Upload date

Type

Duration

Sort by

Features

Reset

33,142 results

Michel van Biezen
Electrical Engineering: Ch 15: Frequency Response (18 of 56) Bode Plot: A Simple Example

Visit http://ilectureonline.com for more math and science lectures! Before analyzing the Bode function for each of the 7 factors for a ...

5:24
Electrical Engineering: Ch 15: Frequency Response (18 of 56) Bode Plot: A Simple Example

180,768 views

6 years ago

UConn HKN
Signals and Systems - Bode Plots

Andrew Finelli, of UConn HKN, creates the Bode Plots for a given transfer function.

18:04
Signals and Systems - Bode Plots

199,248 views

10 years ago

UConn HKN
UConn HKN - Signals and Systems - Bode Plot

Andrew Finelli of UConn HKN introduces an important Signals and Systems topic: creating a Bode Plot given a transfer function.

14:37
UConn HKN - Signals and Systems - Bode Plot

13,731 views

10 years ago

Brian Douglas
Control System Lectures - Bode Plots, Introduction

I go through how it is generated and why we use it to visualize the frequency response of a system across the entire frequency ...

12:45
Control System Lectures - Bode Plots, Introduction

1,360,820 views

13 years ago

Engineering with Prof. Kim
Intro to Control - 15.2 Bode Plot Approximation Example

Going through how to draw the approximate bode plot for a system with one zero and two poles.

10:53
Intro to Control - 15.2 Bode Plot Approximation Example

130,593 views

11 years ago

University of Utah: Professor Angela Rasmussen
Transfer Function from Circuit and creating its Bode Plots

... look at plotting what is called the bode plots so our goal today is to analyze this circuit first to achieve the transfer function so as ...

13:54
Transfer Function from Circuit and creating its Bode Plots

7,605 views

5 years ago

CAN Education
Deriving the Transfer Function from Bode Plot 💡 Example 1

In this video, we will discuss how to determine the transfer function from a Bode plot. Deriving a mathematical model of a plant is ...

19:24
Deriving the Transfer Function from Bode Plot 💡 Example 1

56,944 views

4 years ago

Curio Res
Bode Plots Explained

Bode plots are an essential but sometimes confusing tool for frequency domain analysis. In this video, we'll start with an intuitive ...

13:53
Bode Plots Explained

92,267 views

2 years ago

MAFarooqi
LCS21 - 40b - Bode diagram of transfer functions with multiple factors

This lecture explains the by hand sketch of asymptotic Bode diagrams for transfer functions with multiple factors.

12:45
LCS21 - 40b - Bode diagram of transfer functions with multiple factors

26,398 views

4 years ago

Aleksandar Haber PhD
Sketch Bode Plots by Hand 1: First-Order Transfer Function

controltheory #mechatronics #systemidentification #machinelearning #datascience #recurrentneuralnetworks #signalprocessing ...

17:56
Sketch Bode Plots by Hand 1: First-Order Transfer Function

2,550 views

2 years ago

Aniket Khandekar
L67 Transfer function from Bode plot

In this video the procedure to determine transfer function of a system from its Bode plot is explained for systems without and with ...

10:56
L67 Transfer function from Bode plot

8,734 views

4 years ago

Engineering Funda
Bode Plot Example: Identifying Transfer Function from Gain Plot in Control Systems

Bode Plot Example is covered by the following Outlines: 1. Bode Plot 2. Bode Plot Basics 3. Bode Plot Example 4. Bode Plot ...

9:16
Bode Plot Example: Identifying Transfer Function from Gain Plot in Control Systems

104,924 views

4 years ago

MAFarooqi
LCS - Archive - 40b - Bode diagram of a transfer function with multiple factors

Course Title: Linear control systems Course Link: ...

9:00
LCS - Archive - 40b - Bode diagram of a transfer function with multiple factors

1,929 views

5 years ago

EasyMechLearn
Find Transfer Function from Bode (Magnitude) Plot: Lect no.1

Find Transfer Function from Bode Magnitude Plot | Lecture 1 | Control Systems Tutorial In this lecture, we explain how to ...

14:34
Find Transfer Function from Bode (Magnitude) Plot: Lect no.1

73,945 views

7 years ago

MATLAB
Nichols Chart, Nyquist Plot, and Bode Plot | Control Systems in Practice

Explore three popular methods to visualize the frequency response of a linear time-invariant (LTI) system: the Nichols chart, the ...

17:51
Nichols Chart, Nyquist Plot, and Bode Plot | Control Systems in Practice

127,965 views

5 years ago

Engineering Prof.
How to find Transfer Function of an amplifier from Bode Plot

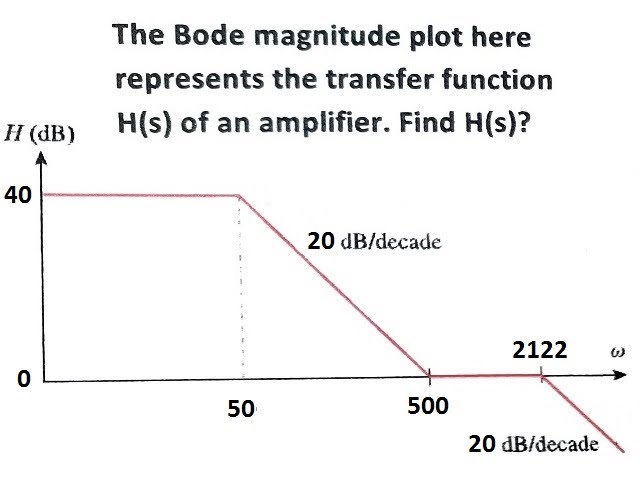
Example shows how we can find S domain transfer function of an amplifier from the Bode plot of it's magnitude response in ...

4:28
How to find Transfer Function of an amplifier from Bode Plot

5,000 views

5 years ago

University of Utah: Professor Angela Rasmussen
Bode plots with multiple poles at origin

... we have multiple poles at the origin so this was one of those other cases so here we have a the equation the transfer function in ...

11:29
Bode plots with multiple poles at origin

7,302 views

5 years ago

Signals Systems
How to find transfer function from Bode Plot
17:07
How to find transfer function from Bode Plot

47,562 views

8 years ago

Nikhil Nakka EE
Finding Transfer Function from Bode Plot Part 1 | Control Systems | RLC Education India

Visit: www.rlceducation.com for full course Introducing A HYS (High Yielding Series) course to crack GATE, ESE, PSUs, SSC JE ...

18:07
Finding Transfer Function from Bode Plot Part 1 | Control Systems | RLC Education India

19,062 views

6 years ago

Ceresapien
Final Exam Tutorial - Bode Plot Example

So our first question asks us to draw the bode plot for the following transfer function s plus 10 over s times s squared plus 3 s plus ...

7:20
Final Exam Tutorial - Bode Plot Example

16,830 views

5 years ago

Raiya Academy
How to Derive a Transfer Function Given a Bode Plot (Part 3)

Reverse engineering. Here, you are given a bode plot and asked to find the transfer function associated with it.

10:37
How to Derive a Transfer Function Given a Bode Plot (Part 3)

21,072 views

6 years ago

Kelsey Cameron
Graphing the Bode Plot Phase of a Transfer Function

I explain how bode plot phase diagrams work. The key takeaways here are that a negative exponent means a negative slope, and ...

9:40
Graphing the Bode Plot Phase of a Transfer Function

853 views

8 years ago

CPPMechEngTutorials
ME 340: Example - Drawing Bode Plot of a Transfer Function #2

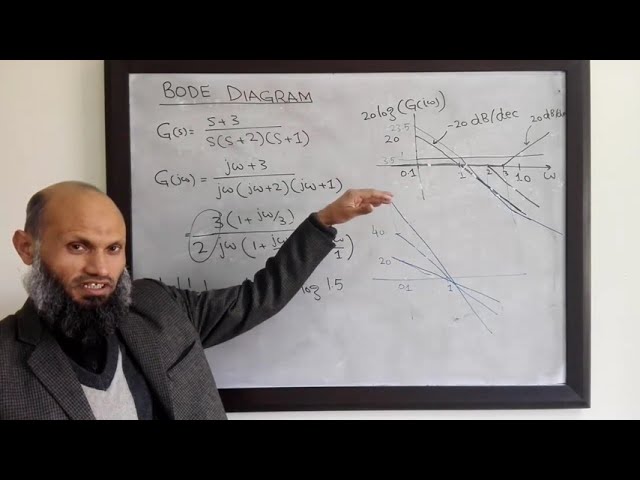
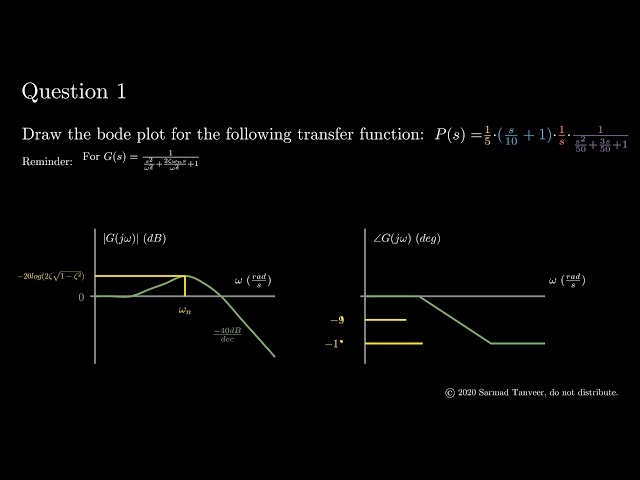
So this case we have to draw a bode diagram for the following transfer function. So first of all we have to convert the transfer ...

11:15
ME 340: Example - Drawing Bode Plot of a Transfer Function #2

11,879 views

8 years ago

Michel van Biezen
Electrical Engineering: Ch 15: Frequency Response (19 of 56) Bode Plot: The Standard Form

Visit http://ilectureonline.com for more math and science lectures! Before analyzing the Bode function for each of the 7 factors for a ...

4:29
Electrical Engineering: Ch 15: Frequency Response (19 of 56) Bode Plot: The Standard Form

59,267 views

6 years ago

MATLAB
Frequency response design using sensitivity functions |Using Bode Plots, Part 1

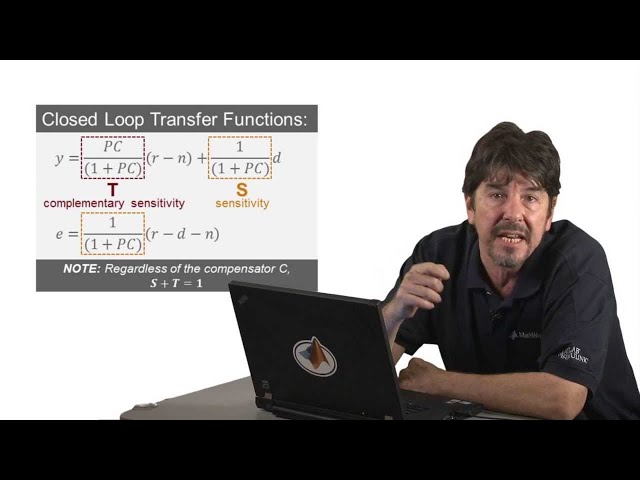
Learn the desired frequency domain shapes for sensitivity and complementary sensitivity transfer functions in this MATLAB® Tech ...

6:12
Frequency response design using sensitivity functions |Using Bode Plots, Part 1

49,781 views

12 years ago