ViewTube

ViewTube
Sign inSign upSubscriptions
Filters

Upload date

Type

Duration

Sort by

Features

Reset

398 results

PythonGuides
Create Subplots in Matplotlib (Step-by-Step Tutorial)

The topics that I covered in this Python Matplotlib tutorial are glimpses into the matplotlib object, object-oriented matplotlib, ...

26:03
Create Subplots in Matplotlib (Step-by-Step Tutorial)

19 views

6 months ago

SlideScope
Python for Data Visualization  - SubPlots in Matplotlib

pythonfordatascience #learnpython #matplotlib #pieplot So far, we have been creating one plot per figure. But in real-world data ...

49:20
Python for Data Visualization - SubPlots in Matplotlib

12 views

2 months ago

Bro Code
Learn Matplotlib in 1 hour! 📊

python #coding #matplotlib This video serves as an introduction to the Matplotlib Python library. We'll cover the basics of ...

1:00:00
Learn Matplotlib in 1 hour! 📊

62,242 views

2 months ago

Coding With Sagar
Matplotlib Full Course in 1 Shot | Data Visualization for Data Science with Netflix Dataset Project

Masters In Data-Analytics with GenAI with Job Guarantee Program - https://codingwise.in/program/data-analytics Python for Data ...

2:46:14
Matplotlib Full Course in 1 Shot | Data Visualization for Data Science with Netflix Dataset Project

197,182 views

8 months ago

Dr. Rajesh Kumar
Matplotlib Part 2  | Sub Plots | Error Handling | argparse | Seaborn | Python - SICNAP 2025

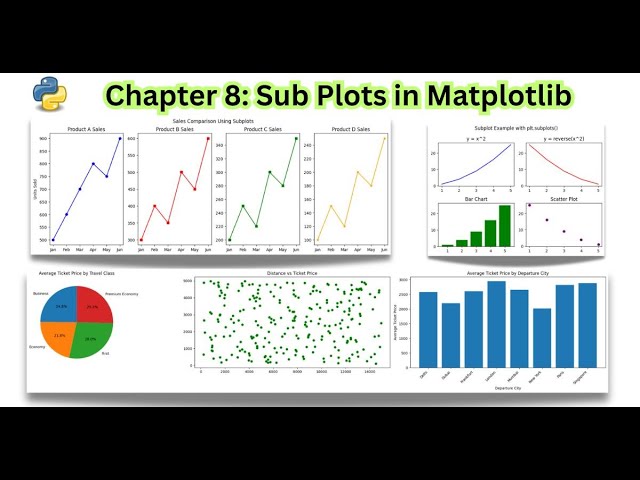
What You'll Learn: Subplots in Matplotlib – Organize multiple plots in a single figure using plt.subplot() and plt.subplots() ...

1:07:17
Matplotlib Part 2 | Sub Plots | Error Handling | argparse | Seaborn | Python - SICNAP 2025

28 views

6 months ago

Geomatics Planet
Matplotlib Grid Lines, Subplots, Scatter, Bars, Histogram & Pie Chart Explained

This video introduces the main plotting features in Matplotlib. You will learn how to add grid lines, create subplots, plot scatter ...

1:08:59
Matplotlib Grid Lines, Subplots, Scatter, Bars, Histogram & Pie Chart Explained

63 views

1 month ago

Mr.Anonymous Coder
Introduction to Histograms in Matplotlib: Master Data Distribution Visualization & Implementation

Introduction to Histograms in Matplotlib: Master Data Distribution Visualization & Implementation #matplotlib #datavisualization ...

1:26:15
Introduction to Histograms in Matplotlib: Master Data Distribution Visualization & Implementation

60 views

6 days ago

LUNARC YouTube Channel
NAISS Training - Matplotlib for Publication - Day 1

NAISS Training - Matplotlib day 1 Matplotlib is among the most popular and advanced function libraries for the production of ...

1:29:45
NAISS Training - Matplotlib for Publication - Day 1

47 views

7 months ago

Data Science-AI-Cloud with Pablo
Data Science Mentor Session - Introduction to Multiple Subplots with Matplotlib

The subplots and again, over here, talked about it here. This is over here. So again we have access, right? So with Subplot in the ...

38:30
Data Science Mentor Session - Introduction to Multiple Subplots with Matplotlib

44 views

Streamed 7 months ago

Dr. Rajesh Kumar
Matplotlib |  Simple Plot | Part 1 | Python - SICNAP 2025

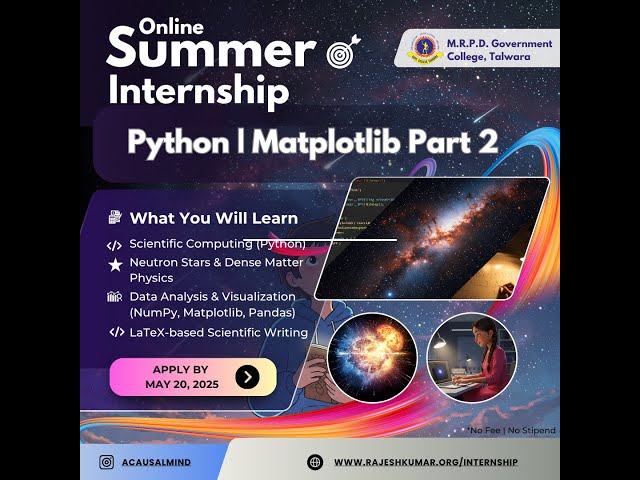
Welcome to another skill-building session from the Summer Internship in Computational Nuclear Astrophysics (SICNAP) 2025 ...

54:07
Matplotlib | Simple Plot | Part 1 | Python - SICNAP 2025

43 views

6 months ago

Mohammad Alhaj (Techno Gate)
58. Python: Matplotlib Library Tutorial (1)

In this video, we explore Matplotlib, one of the most powerful and popular libraries in Python for creating data visualizations.

25:14
58. Python: Matplotlib Library Tutorial (1)

26 views

13 days ago

Data Analytics Lab
Matplotlib Tutorial for Beginners: Line Charts, Scatter Plots & BoxPlots | Python Data Visualization

In this beginner-friendly tutorial, we walk through how to create line charts, scatter plots, and box plots using the powerful ...

24:24
Matplotlib Tutorial for Beginners: Line Charts, Scatter Plots & BoxPlots | Python Data Visualization

1,262 views

8 months ago

Data Science For Everyone
The Ultimate Guide to Matplotlib | Python

This is the ultimate guide to Matplotlib using an Object Oriented approach. I have covered the following topics in this video: 1.

30:13
The Ultimate Guide to Matplotlib | Python

426 views

6 months ago

Techzone Learning
Matplotlib Tutorial for Python — Create Beautiful Pie Plot 3 (Beginner → Advanced)

Learn Matplotlib from scratch to advanced usage in this step-by-step Python tutorial. We'll cover plotting basics, figure & axes, ...

54:21
Matplotlib Tutorial for Python — Create Beautiful Pie Plot 3 (Beginner → Advanced)

20 views

2 months ago

0xVishal
Matplotlib Tutorial – Subplots, Savefig, imread & Colorbar in Python | EP 3

Welcome to the final episode of the Matplotlib Tutorial Series! In this video, we'll explore some advanced and practical features ...

25:23
Matplotlib Tutorial – Subplots, Savefig, imread & Colorbar in Python | EP 3

7 views

4 months ago

NUIST-IMSA
Introduction to Python Class 07 : Introduction to Matplotlib

Welcome to this in-depth guide to Matplotlib, the most popular data visualization library in Python! This tutorial is designed to take ...

2:00:03
Introduction to Python Class 07 : Introduction to Matplotlib

50 views

5 months ago

Coding Fab
📊【Python Matplotlib】Visualize Data with Python Like a Pro!

Master Data Visualization with Matplotlib — The Essential Python Library! Matplotlib is the backbone of Python data visualization.

20:18
📊【Python Matplotlib】Visualize Data with Python Like a Pro!

96 views

6 months ago

CodeAI Flow
Python Matplotlib Tutorial: Practical Stock Analysis of Apple & Google

Stay tuned: https://www.youtube.com/@digitalProgramLife?sub_confirmation=1 ☕️ I'm glad I can share all this for free!

34:06
Python Matplotlib Tutorial: Practical Stock Analysis of Apple & Google

53 views

3 months ago

programography
Lecture - 5 | Subplots in  Matplotlib | More in Scatter() chart

Lecture - 5 | Subplots in Matplotlib | More in Scatter() chart Lecture Work ...

43:32
Lecture - 5 | Subplots in Matplotlib | More in Scatter() chart

54 views

5 months ago

LetsUpgrade
Box Plots in Python: Turn Messy Data into Clear Visuals (Matplotlib & Seaborn)

Mark Attendance & Submit Assignment at One Place → https://luc.to/vddec25d1 Join Data Science Discussion group to get daily ...

49:31
Box Plots in Python: Turn Messy Data into Clear Visuals (Matplotlib & Seaborn)

66 views

8 days ago