ViewTube

ViewTube
Sign inSign upSubscriptions
Filters

Upload date

Type

Duration

Sort by

Features

Reset

563 results

NeuralMinds
Matplotlib for Beginners | Line, Bar, Scatter, Pie & Histogram Explained with Examples

Matplotlib for Beginners | Line, Bar, Scatter, Pie & Histogram Explained with Examples @NeuralMinds3 Matplotlib Jupyter ...

41:55
Matplotlib for Beginners | Line, Bar, Scatter, Pie & Histogram Explained with Examples

27 views

11 days ago

Geomatics Planet
Matplotlib Grid Lines, Subplots, Scatter, Bars, Histogram & Pie Chart Explained

This video introduces the main plotting features in Matplotlib. You will learn how to add grid lines, create subplots, plot scatter ...

1:08:59
Matplotlib Grid Lines, Subplots, Scatter, Bars, Histogram & Pie Chart Explained

0 views

3 weeks ago

Franco Di Leo
8. Python para ingeniería (Matplotlib y Sympy)

En esta clase seguimos viendo gráficas con Matplotlib y comenzamos a hablar de computación simbólica para calcular ...

1:37:10
8. Python para ingeniería (Matplotlib y Sympy)

49 views

2 weeks ago

HPC2N
Lecture 1: day 3, A brief intro to Matplotlib

First lecture from day 3 of the "Introduction to Python and Using Python in an HPC environment" course which was given on ...

47:16
Lecture 1: day 3, A brief intro to Matplotlib

0 views

3 weeks ago

ACTE Chennai
Data Visualization in Matplotlib | Python Practical Tutorial for Beginners

In this video, we dive into Data Visualization using Matplotlib, one of the most powerful and widely used libraries in Python for ...

37:58
Data Visualization in Matplotlib | Python Practical Tutorial for Beginners

3 views

4 weeks ago

Maven Analytics
Python 101 for Data Analysts | Open Campus 2025

Python consistently comes up as one of the most in-demand skills in data, used by Data Analysts, Data Scientists, and Data ...

1:02:45
Python 101 for Data Analysts | Open Campus 2025

3,897 views

4 weeks ago

SlideScope
Matplotlib - Python Bar Charts - Full Tutorial  - Grouped, Stacked Bar and more

matplotlib #datavisualization #dataanlysis #barcharts #charts #visuals.

1:20:38
Matplotlib - Python Bar Charts - Full Tutorial - Grouped, Stacked Bar and more

74 views

Streamed 12 days ago

Tea Time
Python Data Visualization Solutions

Create attractive visualizations using Python's most popular libraries Set up an optimal Python environment for data visualization ...

3:27:27
Python Data Visualization Solutions

0 views

3 weeks ago

Franco Di Leo
7. Python for Engineering - Matplotlib Part 1

In this class of the Python for Engineering course, we begin to look at the matplotlib library to start making graphs of our ...

52:54
7. Python for Engineering - Matplotlib Part 1

43 views

4 weeks ago

Techstack
Matplotlib Tutorial in Hindi (Part 1) | Python Data Visualization for Beginners | Techstack Academy

Welcome to this Matplotlib Tutorial in Hindi by Techstack Academy! In this first class of our Matplotlib course, you will learn what ...

1:02:10
Matplotlib Tutorial in Hindi (Part 1) | Python Data Visualization for Beginners | Techstack Academy

24 views

10 days ago

infotechcell
Matplotlib-Strong Python Liabrary for Data Analysis ** Data Analysis with Python ** Class13 of 20 **

Matplotlib-Strong Python Liabrary for Data Analysis ** Data Analysis with Python ** Class13 of 20 ** Data Source Link: ...

1:43:34
Matplotlib-Strong Python Liabrary for Data Analysis ** Data Analysis with Python ** Class13 of 20 **

102 views

3 weeks ago

Youven
Animate Scientific Data in Python | Matplotlib Animation Tutorial for Researchers

Bring your scientific data to life with animated visualizations! Learn how to create professional animations in Python using ...

41:13
Animate Scientific Data in Python | Matplotlib Animation Tutorial for Researchers

0 views

2 days ago

Think Like Data
Day 9 of Python Session

Welcome to Day 09 of our Python & Data Science learning series! In today's session, we dive deep into Data Visualization using ...

46:39
Day 9 of Python Session

54 views

4 weeks ago

CyborGeek
Hands on training on numpy, pandas and matplotlib part-I

There are important libraries of python such as pandas, numpy and matplotlib. These are open source library packages used for ...

22:47
Hands on training on numpy, pandas and matplotlib part-I

28 views

3 weeks ago

Tech Keys X
Python ML Crash Course: How to do MATPLOTLIB  Dark Mode and Cyberpunk Graphs | S1 EP9

Topics Covered: ⏱ Time Topic 00:00 Intro 00:02 Dark Mode Graphs with Matplotlib Easily 02:10 Cyber Punk Sytle Graphs with ...

21:50
Python ML Crash Course: How to do MATPLOTLIB Dark Mode and Cyberpunk Graphs | S1 EP9

101 views

1 month ago

GSInfotekh
Master Data Science With Python – Session 6 | Data Analysis & Visualization Tutorial for Beginners

Welcome to Session 6 of our Data Science with Python Series! In this session, you'll learn essential data analysis and ...

49:03
Master Data Science With Python – Session 6 | Data Analysis & Visualization Tutorial for Beginners

5 views

2 weeks ago

DataLearnm
09 | Python Data Visualization | Master Seaborn & Matplotlib with Practical Examples

Unlock the power of Data Visualization in Python with this beginner-friendly tutorial on Seaborn and Matplotlib. In this video, you'll ...

35:33
09 | Python Data Visualization | Master Seaborn & Matplotlib with Practical Examples

86 views

13 days ago

AI Coder - Khushboo
Day 52: Python MATPLOTLIB Plots - Multiple Line Plot & 3D Plot | Step By Step | Complete AI Journey

Day 52: Python MATPLOTLIB Plots - Multiple Line Plot & 3D Plot | Visualization Library | Step by Step Examples | Complete AI ...

28:40
Day 52: Python MATPLOTLIB Plots - Multiple Line Plot & 3D Plot | Step By Step | Complete AI Journey

95 views

1 month ago

TekDynamics - Predictive ML and Validation
📖How Accurate Are Your ML Predictions? Improve with Standardization & Log Transform | Tutorial🧾

How correct are your machine learning predictions? In this complete step-by-step tutorial, I demonstrate how to dramatically ...

1:02:35
📖How Accurate Are Your ML Predictions? Improve with Standardization & Log Transform | Tutorial🧾

52 views

2 weeks ago

Karim Rahimian
0003 plotting1 Basic command in matplotlib

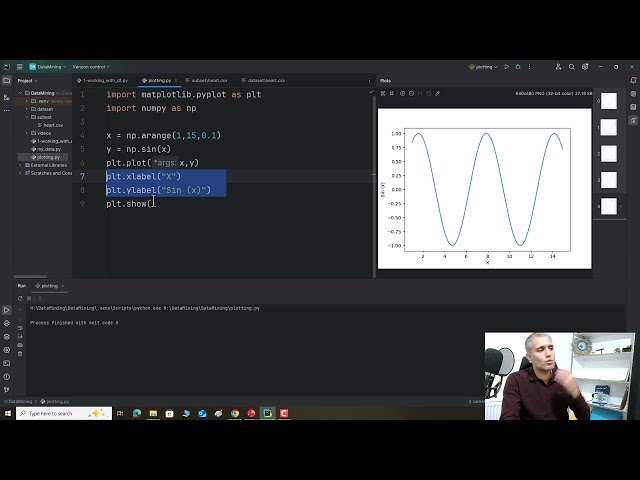
How we cat create a plot with matplotlib. This is the start video.

23:07
0003 plotting1 Basic command in matplotlib

15 views

1 month ago