ViewTube

ViewTube
Sign inSign upSubscriptions
Filters

Upload date

Type

Duration

Sort by

Features

Reset

94 results

Marius
2D plots on Matlab
34:53
2D plots on Matlab

10 views

10 months ago

MATLAB TECH
MATLAB TUTORIAL | HOW TO DRAW 3D PLOTS IN MATLAB?

This video offers a comprehensive beginner's guide to 3D plotting in MATLAB, covering key concepts and commands to create ...

34:33
MATLAB TUTORIAL | HOW TO DRAW 3D PLOTS IN MATLAB?

102 views

4 months ago

Rishabh Gupta Maths
Learn MATLAB from Scratch in Hindi🔥 | Lecture 3: 2D Plot | MATLAB for College Students

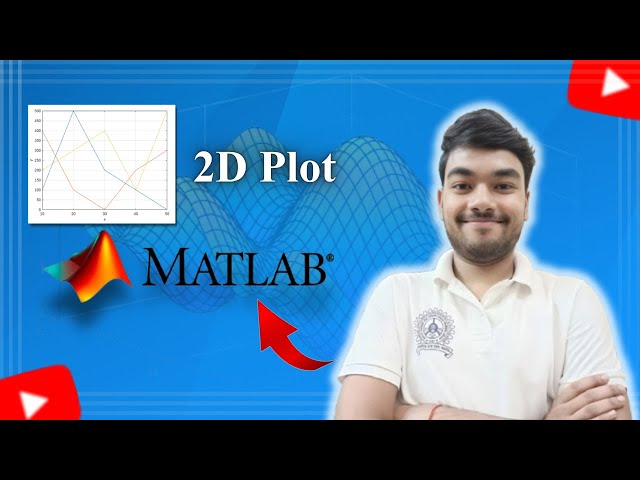
Welcome to Lecture 3 of the Learn MATLAB from Scratch Series! In this lecture, you'll learn how to create 2D plots in ...

21:41
Learn MATLAB from Scratch in Hindi🔥 | Lecture 3: 2D Plot | MATLAB for College Students

42 views

2 months ago

Phil Parisi
2025 MATLAB Beginner Course with Example Project and Solution | MATLAB Training

This introductory MATLAB course builds a foundation for new MATLAB programmers and engineers! We cover variables, data ...

56:28
2025 MATLAB Beginner Course with Example Project and Solution | MATLAB Training

657 views

1 month ago

asaan programming
MATLAB COURSE, 2d graphs using plot command, linespecifiers, property name and property value

MATLAB COURSE, 2d graphs using plot command, linespecifiers, property name and property value how to plot graphs in matlab ...

21:15
MATLAB COURSE, 2d graphs using plot command, linespecifiers, property name and property value

18 views

1 month ago

THE MATLAB MENTOR
Extract Data from Tables & Create Contour Plots in MATLAB | Ocean Measurements Tutorial.

In this MATLAB tutorial, we'll explore how to extract specific data from tables and create stunning contour plots to visualize ocean ...

47:45
Extract Data from Tables & Create Contour Plots in MATLAB | Ocean Measurements Tutorial.

29 views

2 months ago

Dr. G_Hekal
Lec 3: 2D and 3D plots in MatLab
57:30
Lec 3: 2D and 3D plots in MatLab

154 views

2 months ago

Mathlab Explorers
Graphing Strategies in MATLAB | Dr. Alamin Khan Part 06

... graphing strategies in MATLAB, MATLAB 3D plot, MATLAB 2D plot, MATLAB lecture, Jahangirnagar University mathematics, ...

1:16:29
Graphing Strategies in MATLAB | Dr. Alamin Khan Part 06

20 views

3 months ago

MATLAB TUTORIAL
MATLAB TUTORIAL Class 23🔥3D Plots in MATLAB🔥#matlabtutorial #matlabtutorials #matlab #plot #3d

MATLAB Plot Function Tutorial Mastering MATLAB plots Matlab tutorial for beginners: 2D Plot (Hindi) MATLAB 3D Plotting Line ...

30:46
MATLAB TUTORIAL Class 23🔥3D Plots in MATLAB🔥#matlabtutorial #matlabtutorials #matlab #plot #3d

80 views

10 months ago

THE MATLAB MENTOR
MATLAB Scatter & Stem Plots Masterclass | Variable Size/Color, Tables & 3D Stem

Learn how to take your MATLAB plots to the next level! In this tutorial, we cover: Creating scatter plots with variable size and ...

46:26
MATLAB Scatter & Stem Plots Masterclass | Variable Size/Color, Tables & 3D Stem

18 views

4 months ago

Solo Technology Education
7 Matlab Octave advanced plotting

Advanced 2D plotting (plot, countour, contourf, bar, hist, plotmatrix, ....) * 3D plotting (plot3, meshgrid, mesh, scatter3, stem3, surf, ...

58:17
7 Matlab Octave advanced plotting

26 views

5 months ago

Mathlab Explorers
Graphing Strategies in MATLAB | Dr. Alamin Khan Part 04

... graphing strategies in MATLAB, MATLAB 3D plot, MATLAB 2D plot, MATLAB lecture, Jahangirnagar University mathematics, ...

51:27
Graphing Strategies in MATLAB | Dr. Alamin Khan Part 04

20 views

3 months ago

Mathlab Explorers
Graphing Strategies in MATLAB | Dr. Alamin Khan Part 02

... graphing strategies in MATLAB, MATLAB 3D plot, MATLAB 2D plot, MATLAB lecture, Jahangirnagar University mathematics, ...

1:18:15
Graphing Strategies in MATLAB | Dr. Alamin Khan Part 02

41 views

3 months ago

Suppose Math
1. Two Dimensional Plots  using MATLAB | Suppose Math with Akhtar Abbas

For any question, write in the comment section.

35:51
1. Two Dimensional Plots using MATLAB | Suppose Math with Akhtar Abbas

106 views

1 month ago

Javed Mondal
Data Visualization and Function Definition in MATLAB

In this lecture, we explore key plotting techniques in MATLAB, including 2D/3D line plots, bar plots, scatter plots, surface, mesh, ...

1:49:50
Data Visualization and Function Definition in MATLAB

24 views

8 months ago

Mathlab Explorers
Graphing Strategies in MATLAB | Dr. Alamin Khan Part 07

... graphing strategies in MATLAB, MATLAB 3D plot, MATLAB 2D plot, MATLAB lecture, Jahangirnagar University mathematics, ...

58:56
Graphing Strategies in MATLAB | Dr. Alamin Khan Part 07

15 views

3 months ago

Mathlab Explorers
Graphing Strategies in MATLAB | Dr. Alamin Khan Part 05 (3D plots)

... graphing strategies in MATLAB, MATLAB 3D plot, MATLAB 2D plot, MATLAB lecture, Jahangirnagar University mathematics, ...

50:31
Graphing Strategies in MATLAB | Dr. Alamin Khan Part 05 (3D plots)

35 views

3 months ago

Asociación de Matemáticos de El Salvador
MATLAB SEMANA 5

Sistemas de ecuaciones, graficas de funciones en 2D y 3D.

1:30:08
MATLAB SEMANA 5

45 views

6 months ago

Mathlab Explorers
Graphing Strategies in MATLAB | Dr. Alamin Khan Part 03

... graphing strategies in MATLAB, MATLAB 3D plot, MATLAB 2D plot, MATLAB lecture, Jahangirnagar University mathematics, ...

22:01
Graphing Strategies in MATLAB | Dr. Alamin Khan Part 03

33 views

3 months ago

Sergio Laboret
Matlab Basico IV (c): Graficacion Simbolica  en 2 D y  3 D, estructuras de datos, tablas e imagenes

Link al material: https://drive.google.com/file/d/1IXFuV9j0Z7ccox_yqhjStg0Cv6jawhv-/view?usp=sharing.

30:13
Matlab Basico IV (c): Graficacion Simbolica en 2 D y 3 D, estructuras de datos, tablas e imagenes

11 views

1 month ago