Upload date
All time
Last hour
Today
This week
This month
This year
Type
All
Video
Channel
Playlist
Movie
Duration
Short (< 4 minutes)
Medium (4-20 minutes)
Long (> 20 minutes)
Sort by
Relevance
Rating
View count
Features
HD
Subtitles/CC
Creative Commons
3D
Live
4K
360°
VR180
HDR
192,369 results
This comprehensive tutorial will teach you everything you need to know about Excel chart types, chart customization, and creating ...
117,323 views
1 year ago
Learn Excel in just 2 hours: https://kevinstratvert.thinkific.com In this step-by-step tutorial, learn how to pull together charts in Excel.
1,372,320 views
2 years ago
Download the free course files and follow along here: ➡️https://www.simonsezit.com/charts-and-dashboards-in-excel-demo-files ...
13,655 views
Take my Full Excel for Data Analytics Course! https://www.analystbuilder.com/courses/excel-for-data-analytics In this video we ...
1,255,374 views
4 years ago
Download the free course files and follow along here: ...
3,583 views
6 months ago
Ready to transform your spreadsheets from ordinary to extraordinary? In this tutorial, you'll learn how to take raw, unorganized ...
153,740 views
"️ IBM - Data Analyst ...
14,873 views
FREE Course Files & Projects https://lukeb.co/excel_files Supporter Access: Problems, Certificate, & More ...
2,932,400 views
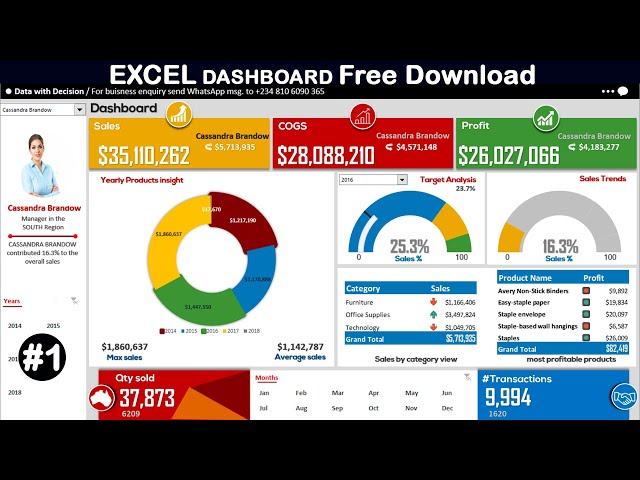
OFF My Dashboards Course (code: SAVE50) https://chandoo.org/wp/excel-school-program/ ~ Become an Excel Dashboard ...
156,030 views
Excel Visualize Your Data Tutorial Get Ad-Free Training by becoming a member today!
16,569 views
See how Python is transforming Excel into a data powerhouse. In this video, we'll demonstrate: • The groundbreaking PY function ...
7,981 views
Excel Data Analysis Full Course Tutorial (7+ Hours) Get Ad-Free Training by becoming a member today!
2,016,850 views
What sets us apart: - Comprehensive breakdown of essential formulas, digital designs, and data visualization techniques.
6,997,101 views
5 years ago
Want the data set to following along? Get it here https://aihr.ac/4nHO7xR How can you build an interactive HR dashboard in ...
116,052 views
excelchart #excelcharts #excelchartstutorial This comprehensive video will teach you everything you need to know about Excel ...
1,955 views
Welcome to this beginner's tutorial on how to use Microsoft Power BI! In this video, I will guide you through importing data from an ...
216,881 views
3 years ago
Free Download: Analyzing and visualizing data with excel will help you get a better insight into your business. Data visualization ...
18,964 views
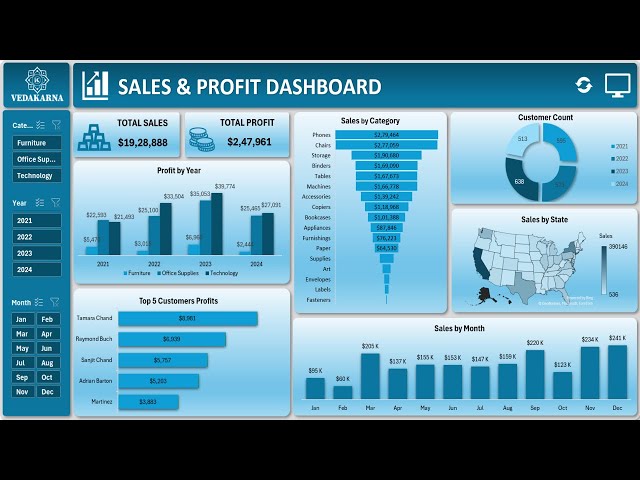
... for more tutorials on Excel with data visualization Let's get started on your journey to mastering dashboards with Vedakarna!
389,488 views
Links mentioned in this video ⬇️ Exercise File ...
255,589 views
You asked for it. Here is my free course on advanced data analytics. Want more... get my Excel School program ...
509,506 views


![How to build an Interactive HR Dashboard in Excel | HR Analytics in Excel [2025]](/api/proxy/image?url=https%3A%2F%2Fi.ytimg.com%2Fvi%2F0IFYY7a5pAo%2Fsddefault.jpg)