Upload date
All time
Last hour
Today
This week
This month
This year
Type
All
Video
Channel
Playlist
Movie
Duration
Short (< 4 minutes)
Medium (4-20 minutes)
Long (> 20 minutes)
Sort by
Relevance
Rating
View count
Features
HD
Subtitles/CC
Creative Commons
3D
Live
4K
360°
VR180
HDR
880 results
Website: neuroscope.retrogradearc.com Learn how to use NeuroScope, a web-based visualization tool designed to make the ...
76 views
3w ago
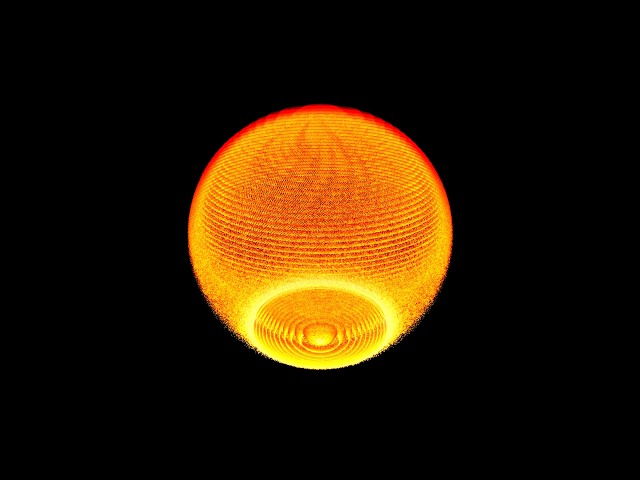
Radix Sort (LSD) visualized on 50000 elements, plotted in polar coordinates - a 25-minute extended mix. Watch Radix Sort ...
14 views
... Algorithm Visualization #ArtificialIntelligence #BFS #DFS #FindingNemo #AISimulation #GraphTraversal #SearchAlgorithms ...
33 views
2w ago
... about mosaic selections managing and optimizing user selections for scalable data visualization systems jeff please great yeah ...
58 views
7d ago
INSERTION SORT sorting algorithm visualized with 256 elements at fluid 4K 60 FPS, synchronized with ambient harmonic ...
10 views
Selection Sort visualized on 50000 elements, plotted in polar coordinates - a 25-minute extended mix. Watch Selection Sort's ...
11 views
Dept. of Computer Science and Engineering (Data Science)
6 views
13d ago
More long-form sorting to relax and sleep to: https://www.youtube.com/playlist?list=PLKjLcavCigAc A glowing sun made of one ...
1,232 views
Comb Sort visualized on 50000 elements, plotted in polar coordinates - a 25-minute extended mix. Watch Comb Sort's unique ...
15 views
Heap Sort visualized on 50000 elements, plotted in polar coordinates - a 25-minute extended mix. Watch Heap Sort's unique ...
583 views
How do AI models actually make medical predictions? In this hands-on tutorial, we are training and visualizing a Neural ...
73 views
Merge Sort visualized on 50000 elements, plotted in polar coordinates - a 25-minute extended mix. Watch Merge Sort's unique ...
In this demo, we walk through a Supply Chain Logistics Knowledge Graph in Samyama Insight. The graph contains 23336 nodes ...
27 views
The Algorithms 0:00 Bubble: adjacent swaps carry the largest to the end. O(n²). 0:52 Cocktail shaker: bubble sort sweeping both ...
636 views
Subscribe for more algorithm visualizations: new sorts every week. #sort #algorithms #visualization #asmr #focus #coding.
43 views
24 sorting algorithms visualized with sound, calm enough to relax or study to. Then all 24 race the same list to see which one ...
16 views
5d ago
Graphs offer a powerful tool for uncovering relationships and hidden patterns between entities. This presentation provides an ...
8 views
Want to master data visualization? Start with Matplotlib! In this short, we break down Matplotlib and the essential concepts every AI ...
329 views
11d ago
The lecture is authored by Dov Kruger and adapted for this video.
22 views
Quick Sort visualized on 50000 elements, plotted in polar coordinates - a 25-minute extended mix. Watch Quick Sort's unique ...
28 views